Our Network is now live on Gitcoin Grants! Donations very much appreciated.
This is issue #50 of the on-chain analytics newsletter that reaches nearly 6500 crypto investors every week 📈
✨ Together with our partners:
1inch, whose v2 offers the best rates by discovering the most efficient swapping routes across all DEXes—swap on the customizable new UI. And also Aave, where you can experience DeFi: Deposit, Earn, & Borrow on Aave.
This week our contributor analysts cover DeFi: Ethereum, Bitcoin, Cosmos and Decred .
① Ethereum
Contributor: Alex Gedevani, Researcher at Delphi Digital
Total ETH sent to the ETH 2.0 Deposit contracts totals 1.37m ETH ($774m), signaling strong demand for participation in Proof of Stake. Since the launch of Phase 0 on Dec 1, ETH deposits as a supply sink have outweighed ETH supply issuance 3.7 to 1. Since the deposit contract was enabled, total ETH deposited as % of newly issued supply has reached 262%. These strong inflows are also driven by higher staking yields, currently at 16% annualized, that are given early on to incentivize validators. As more staking services come on board, whether it be centralized exchanges or liquid staking platforms, this democratizes access to staking. This dynamic coupled with incentives offered by services to attract users will keep ETH deposits flowing even as yields gradually lower. (Source 1 , 2)
With the Beacon Chain live and Phase 0 of the multi-year ETH 2.0 roadmap underway, let’s check in on the latest stats. There are 29,579 active validators with 12,779 pending validators in the queue. Since the Dec.1 launch, queue wait time for pending validators has increased from 6 to almost 14 days. After a slow start, validator participation rates remain elevated above 99%. Unlike the Medalla testnet, there’s higher participation rates now given economic incentives with staked ETH on the line. There have been 14 instances of validators being slashed thus far (3 Proposer Violations, 11 Attestation Violations). Another benefit that ETH 2.0 brings is the incentive for users to run nodes. In the past 30 days, there’s been a 27% increase in nodes online, bringing the current total to 11,137. The Beacon Chain supports the capacity for tens of thousands of validators globally. As validators join the network, it becomes increasingly robust. (Source 1, 2, 3)
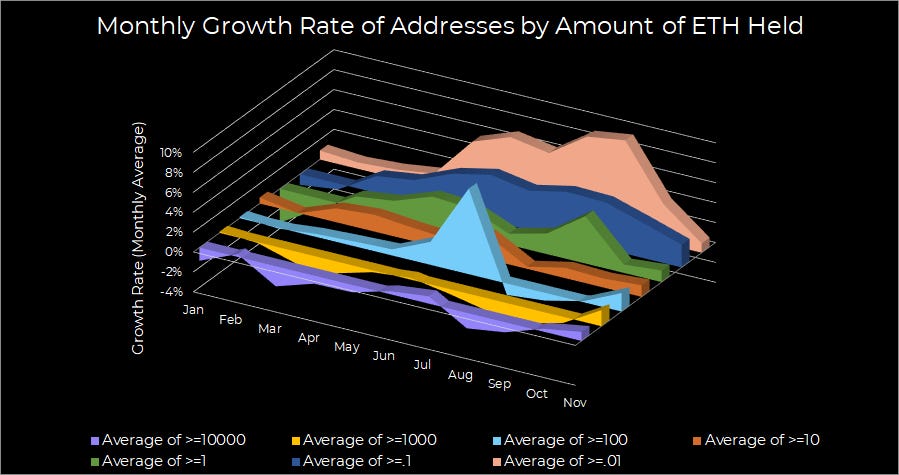
Looking at the number of unique addresses holding varying amounts of ETH highlights the ebbs and flows of market cycles. For example, the DeFi farming frenzy in the summer drove increased growth rates across most of the buckets. Larger growth rates in smaller holdings is a tell on more retail participants joining. On the other hand, the average monthly count of addresses holding >100 ETH grew by 9% in June to 52.8k, partially attributed to more capital heavy market participants, well equipped for farming in high fee environments. Post DeFi summer, there’s been a minor recovery in addresses with larger balances signaling re-accumulation. 7.3k addresses have >= 1,000 ETH (Source)
$506M in fees have been generated YTD up 1,365% vs. $34.5M in fees in 2019. With a thriving ecosystem, sustainable fees are good for the long term sustainability of a network. What really puts things into perspective is comparing Ethereum’s network fees vs other Layer 1s, many of which have minimal usage generating <$1k in daily fees. Bitcoin and Ethereum are in a class of their own regarding fees generated. (Source)
Given ETH’s outperformance, miners have been slowly offloading ETH with aggregate holdings declining from 1.13M ETH to 1.016M ETH since mid-October. In the past 14 days, there’s been a 2% balance draw-down. This is a slower rate than the preceding 14 days, which saw a 5% decrease. As selling slows down, keep an eye out for a potential re-accumulation period to see if there’s renewed positive sentiment. (Source)
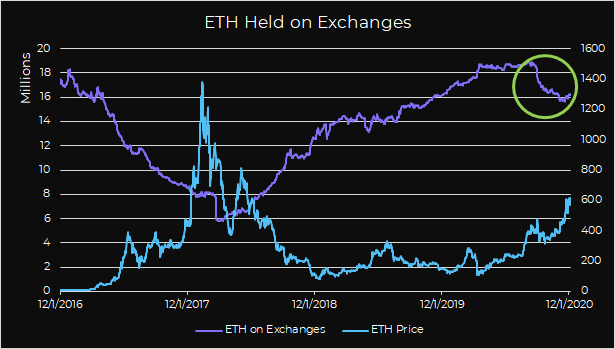
Since early August there’s been a 15.2% decline in the amount of ETH held by centralized exchanges, a bullish sign. Last time a decline of such size was seen was during the 2017 bull run. There’s likely a number of factors driving these outflows ranging from increased focus on self-custody, yield opportunities in DeFi, and long term storage. Also, ~57% of the total ETH supply hasn’t moved in a year (Source 1 , 2)
ETH transaction volume in USD is represented by transaction volume times the average daily price of ETH. It’s another measure of network usage and ETH utility. Transaction volume for December is already on pace to reach $112m.That’d set a new yearly high for monthly volume, passing the September high of $103B. 63% of the YTD volume of $481B has come since September, a strong close to the year. Growth in daily active addresses is up 154% YTD to 401k. (Source)
② Bitcoin
Contributor: Nate Maddrey, Researcher at Coin Metrics
The amount of bitcoin held on exchanges has been declining since March, and has reached its lowest level since late 2018. This trend is interesting for a few reasons. Firstly, it could suggest that more people are self-custodying their bitcoin and removing it from exchanges. If true, this is a positive development and signals that investors are increasingly learning about the pitfalls of holding their funds on exchanges. Secondly, this trend could suggest that institutional investment into bitcoin is increasing. Institutional investors are more likely to use OTC solutions for large purchases, as opposed to centralized exchanges. Lastly, this could be a reaction to the increased regulatory scrutiny on crypto exchanges throughout 2020. BitMEX, Huobi, and others have come under regulators' spotlight, and have subsequently seen their funds decline. Although painful in the short-term, increased regulatory clarity will likely help the industry mature in the long run.
The amount of bitcoin held by relatively large addresses has been increasing over 2020. This chart shows the total amount of supply held by addresses holding 0-1 BTC, addresses holding 1-10 BTC, and so on, going up to addresses holding over 10K BTC. Addresses that hold 1K-10K BTC now collectively hold over 5.3M BTC. Since the overall amount of BTC held by exchanges has been dropping, this suggests that larger, institutional sized investors have been increasingly accumulating.
There are some theories that increased regulatory scrutiny in China has prevented miners from selling their BTC, which has contributed to the price rally. The following chart shows the outflows of addresses one-hop away from block reward distributions. Since a majority of miners self-organize into mining pools, addresses one-hop away mostly represent individual miners that receive BTC from pools. Although outflows from these addresses spiked in March, they have remained at relatively normal levels since.
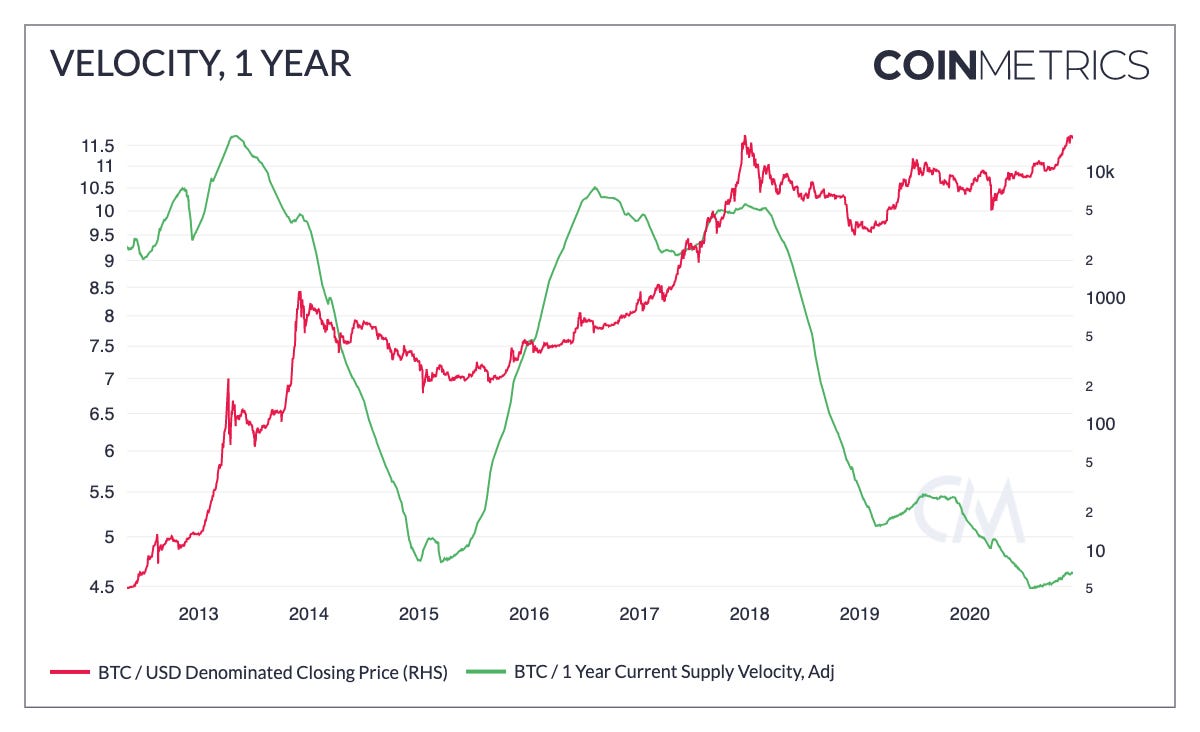
Bitcoin’s one-year velocity remains near historic lows. Velocity can be thought of as a rate of turnover, or in other words the number of times that an average unit of BTC has been transferred within the last year. Historically BTC’s velocity has increased during a bull cycle as on-chain activity increases, and has dipped following both the 2013 and 2017 price peaks. A low velocity may indicate a relatively high level of HODLing, which is a healthy sign for bitcoin going into 2021.
③ Cosmos
Contributor: Chjango, On-Chain Researcher for Cosmos
The rate of new address generation has remained rather constant, but steadily at an inclined slope.


