Welcome to Issue #3 of Our Network, a weekly newsletter where top blockchain projects and their communities share data-driven insights about their networks.
Before we dive into this week’s issue, there’s one fun Crypto Twitter data experiment we need to cover first…
Crypto Twitter’s Top 10 Content Producers
On Wednesday, I asked Crypto Twitter for their favorite content producers. The bar was high — I didn’t want to hear about just anyone, but rather people who you make an effort to consume literally everything they produce.

I had no idea it would happen, but the tweet would end up going viral in the community. Here are the engagement metrics from Twitter Analytics:

All in all, there were more than 750 nominations made, with 372 different content producers represented. Judging by anecdotal feedback from people like ex-Coinbase CTO Balaji Srinivasan, it feels like this exercise produced a high-quality list overall. Maybe we’ll make this an annual tradition.
So without further ado — here is the Top 10:
Nic Carter (23 votes)
Hasu (17 votes)
Su Zhu (15 votes)
GreenEggsnHam (14 votes)
Vitalik Buterin (12 votes)
Willy Woo (12 votes)
Tuur Demeester (10 votes)
Chris Burniske (9 votes)
Ryan Selkis (9 votes)
Scott Melker (8 votes)
Congratulations to everyone who made the cut! And if you’re interested in seeing the full list, you can check it out here:
Network Updates
Moving on to network updates. This week our contributors cover DeFi:

📌 PoolTogether
Contributor: Leighton Cusack, CEO of PoolTogether
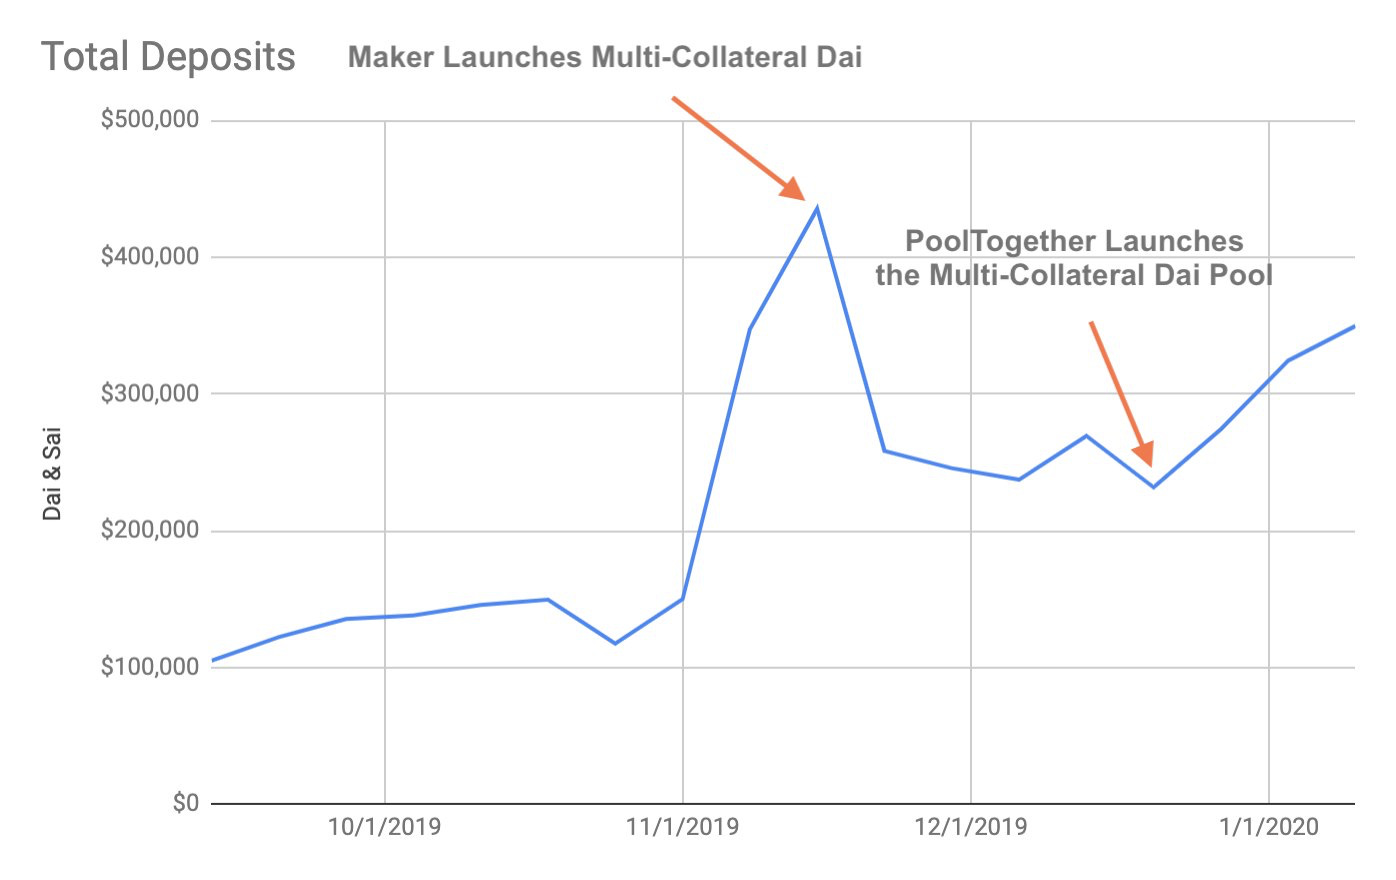
The current version of PoolTogether launched September 4th, 2019. The first weekly prize had 340 unique Ethereum addresses and 105k Dai in the pool. 17 weeks later the pool now has 1,484 unique Ethereum addresses and 346k Dai and Sai — increases of 337% and 230% respectively.


One way to measure growth is in the context of other products in the space. PoolTogether uses Compound Finance to generate interest. The new multi-collateral Dai pool launched on December 20th, between December 20th and January 4th there were 2,358 Dai supply transactions to Compound Finance and 848 of those came through PoolTogether. This means 36% of all Dai supply transactions to Compound came through PoolTogether during this period
(EDIT: an earlier edition of this newsletter incorrectly stated this figure as 36% of volume — it has been changed for accuracy to reflect transaction count. PoolTogether only accounts for 1.43% of Compound Sai + Dai.)
PoolTogether is a game designed to incentivize savings, so user retention is an important metric. The first pool had 340 unique Ethereum addresses. 9 weeks later (when Multi-collateral Dai was launched) 257 of the same Ethereum addresses remained, a 76% retention rate for the cohort during that time.
Each PoolTogether ticket costs 1 Dai. The median ticket purchase amount is 20 and 81% of players purchase less than 100 tickets (as seen in the chart below). The 19% of players that hold more than 100 tickets own 77% of all tickets.

📌 0x
Contributor: Alex Kroeger, Data Scientist at 0x
In 2019, 0x was heavily focused on liquidity, believing that it will be a primary attribute around which DEXs will increasingly compete to differentiate themselves. One of the primary metrics for performance comparison is slippage, which describes how far the realized price moves (%) in response to a trade of a certain size. Lower slippage means deeper liquidity and better prices for users. The figure below shows slippage and volume over Radar Relay for ETH-DAI. The data suggests increasing liquidity (lowering slippage) leads to greater volume. For a $1K trade on ETH-DAI, slippage decreased from roughly 75 basis points to 25 basis points over 2019, while 7-day volume rose from roughly $200K to $1-2M. In 2020, 0x is maintaining a focus on liquidity, aiming to have substantial liquidity available over v3 of our protocol (read more).

The composability of DeFi (the ability of projects to interact with one another via smart contracts) will likely commoditize liquidity—users and dApps will choose to trade on the protocol that provides the best price. This has already started to happen with the growth of DEX aggregators, including dex.ag, 1inch exchange, Totle, and Paraswap, who can mix and match orders from multiple DEX protocols to get the best price for traders. This is favorable to the end-user, as they will be able to get the best possible prices any time they need to swap assets (whether that activity is trading or interacting with a dApp). The figure below () shows rolling 7-day volume (USD) for 1inch exchange, which now totals $1-2M in volume per week and has been growing.

0x has been a major provider of liquidity for DEX aggregation both through open orderbook relayers like (Radar Relay and Bamboo Relay) and facilitating direct access to quotes from market makers that can be filled on-chain via 0x. 0x orders have been supplying ~20% of the liquidity on 1inch exchange, as shown in the figure below. 0x is also starting to support DEX aggregation natively with the introduction of “ERC-20 Bridge” contracts, which allow a user to fill orders backed by liquidity from other protocols.

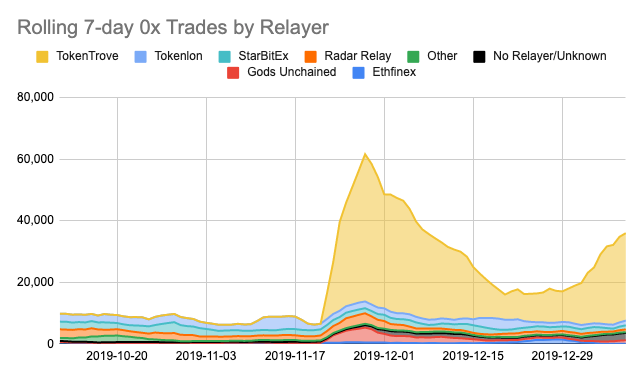
NFT trades are an exciting area for growth in DEX trading. In November, the launch of Gods Unchained card trading led to a 10X spike (see figure below) in the number of trades using the 0x exchange contract, led by TokenTrove and the Official Gods Unchained Marketplace. We foresee growth in this area as more projects take advantage of tokenizing cards and game collectibles as a way to fund indie game development.

📌 Kyber Network
Contributor: Deniz Omer, Head of Ecosystem Growth at Kyber
The volume of all trading activity on Kyber Network (including trades through dapp, wallet, and Defi smart contract integrations) has grown from $70M in 2018 to $380M in 2019. Growth has been led by an increase in liquidity demand from the DeFi space as well as growth in KyberSwap volumes.

Volumes themselves do not give a full picture since market volatility can artificially increase or decrease volumes and that is why we also look at total trades carried out on Kyber. Here we see an upward trend since mainnet launch in Q1 2018.

Providing liquidity across the Ethereum dapp ecosystem has been one of Kyber’s cornerstone goals and in 2019, ~60 new dapps, DeFi products and wallets integrated Kyber for their liquidity needs, accounting for more than half of all Kyber volume. Integrations can be seen on this ecosystem map here.

There are 51,570 unique holders of KNC. As part of a major protocol upgrade called Katalyst coming in Q2 2020, these KNC holders will be able to govern the KyberDAO to set protocol parameters (rebate/reward/burn ratios), and in return, receive part of the network fees.

📌 dYdX
Contributor: Zhuoxun Yin, Head of Strategy and Operations at dYdX
dYdX had a massive 2019, growing trade volume, loan originations and launching native spot markets. So let's dig in. Starting with trade volume - since the launch of dYdX’s V2 protocol in May 2019, quarterly trade volume has grown significantly from <$5M in Q1 (pre-launch) to $78.5M in Q4. This is also in the face of a weaker market for ETH trading.

dYdX is originating loans at breakneck speed - $169M in the last 3 months and $289M since we launched V2 in May 2019. What’s more interesting is the breakdown of these loan originations. On dYdX there are broadly 3 ways a loan can be originated. (1) A direct collateralized borrow. (2) By opening an isolated margin position. (3) By trading into a negative balance (this includes flash borrowing and cross margin). This third category has been increasing as a proportion recently, led by traders on dYdX who are placing limit orders on margin, allowing them to trade in a more capital-efficient manner, and flash borrowers performing liquidations.

dYdX launched native spot markets in September 2019, with the ETH-DAI spot market consistently in the top 3 ETH-DAI markets alongside Oasis and Coinbase. We believe much of this is due to being able to combine trade finality alongside a non-custodial offering. As more traders have flocked to the exchange, our ETH-DAI spread has compressed considerably.

Lastly, as more trade volume and loan origination occurs on dYdX - so do liquidations. Over $30M of collateral has been liquidated on dYdX. After dYdX released a liquidator bot (https://github.com/dydxprotocol/liquidator), it has also been great to see the concentration of liquidators decrease, as more funds and individuals started to generate alpha within dYdX and elsewhere in DeFi.

📌 Fiat-backed Stablecoins
Contributor: Jai Prasad, CEO at TokenAnalyst
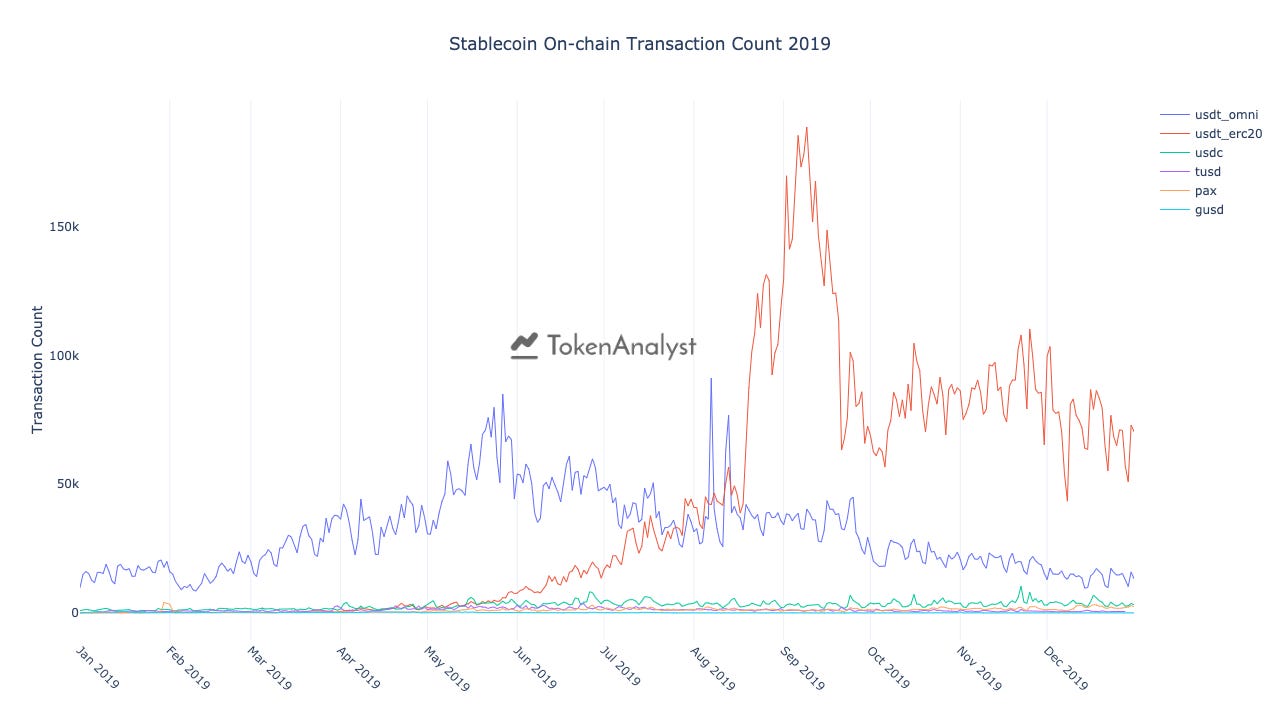
In 2019, Tether remained the top fiat-backed stablecoin in crypto, and it notably expanded from Omni-Layer to Ethereum and Tron. In the graph below, you can visualize the shift from Omni to Ethereum as USDT_OMNI on-chain volume declined as the year progressed while USDT_ERC20 on-chain volume picked up considerably. On Ethereum, USDT_ERC20 quickly became the top fiat-backed stablecoin, doing ~$127B of on-chain volume in 2019 compared to ~$27B for USDC.

There is an average of ~40k daily USDT_ERC20 on-chain transactions compared to an average of ~3k on-chain transactions for USDC.

What is Tether actually being used for you ask? The total on-chain volume of USDT_ERC20 was ~127B in 2019. ~$16B or 12.5% of USDT_ERC20 volume can be attributed to traders moving funds in/out of just Binance (just one exchange).

USDC monthly transaction count grew 3x from a total of ~36K on-chain transactions in January to ~110K on-chain in December.

Our Network is a weekly newsletter where top blockchain projects and their communities share data-driven insights. Subscribe now to receive a crash course in on-chain metrics and crypto fundamentals, and never miss an issue.
About the editor: Spencer Noon leads investments for DTC Capital, a fundamentals-focused crypto fund. He actively tweets about on-chain metrics.

