Click here to support Our Network on Gitcoin Grants
This is issue #26 of Our Network, the free newsletter about on-chain analytics that reaches almost 2500 crypto investors every week.
New Brand Identity
Before we jump into this week’s coverage, today I am excited to officially unveil Our Network’s new brand identity. Designed by Lili Feyerabend, the new look captures our community-oriented and open approach to using data to clarify, educate and empower everyone in the crypto ecosystem. I highly recommend checking out Lili’s blog post on the concept if you’re interested in design:


This week our contributors cover Compound, Stablecoins, Aave, Terra and Celo.
1. Compound
Contributor: Nick Martitsch, Business Development at Compound
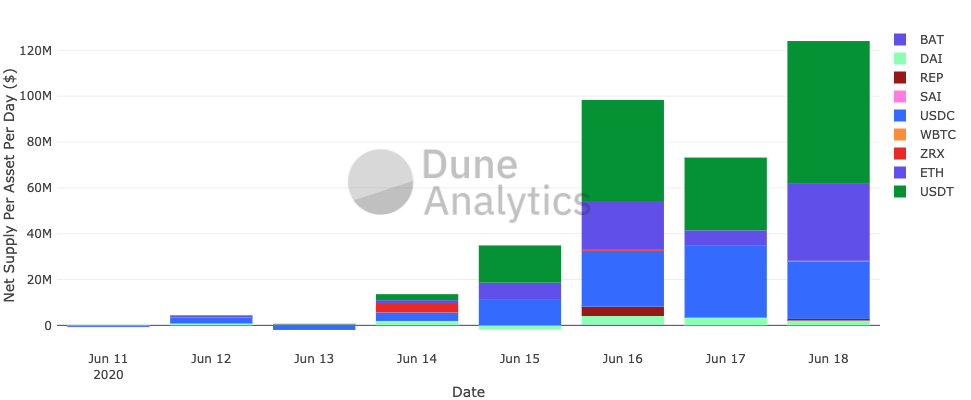
Total supply on Compound is currently at $480 million from 23,000 unique addresses. In the past seven days, approximately $573 million (gross) was added to the protocol, in almost 14,000 transactions. This graph shows the increase in the net supply per day, broken down by token. About 42% of this volume was USDT, 27% was USDC, 20% was ETH, and 6% was DAI. Demand for cUSDT on Compound has increased dramatically in the last week, with gross supply rising from $1mm on June 11th to $170mm at the time of publication (source: Compound, Loan Scan).

2,880 COMP tokens are distributed every day (0.5 per Ethereum block) to users of the protocol, proportional to the interest generated in each market. In this graph, you can see the roughly 11,520 total COMP that has been earned across all Compound markets, with 91% of COMP going to USDT suppliers/borrowers. USDT has surpassed ETH to become the largest market on Compound, prompting members of the community to discuss interest rate model updates to other markets such as USDC (source).

There is currently $120mm of outstanding USDT borrow, representing nearly 5x the borrowing amount of all other markets combined. Supply and Borrow rates for USDT are currently 12% and 17%, respectively. You can see from the downward trend of “COMP earned per $1 borrowed” that the total amount of borrowing is growing rapidly, lowering the total amount of COMP received for each $1 borrowed. Real-time COMP allocations by market can be viewed on the User Distribution Page of the Compound website (source).

COMP token holders do not need to directly participate in the voting process for protocol modifications - a core feature of COMP is the delegation of voting rights. So far there have been 437 total delegations, 383 of which are brand new delegations from a new COMP-holding address, and 54 of which are re-delegations, that is they are re-assignments of delegations from one address to a different one. This table shows the top 10 delegates by the number of unique delegators. You can visit the COMP leaderboard to view the top addresses ranked by voting weight, and if you have COMP, you can visit the Vote interface to delegate your voting power to any address of your choosing - including yourself!

2. Stablecoins
Contributor: Alex Svanevik, co-founder of Nansen and D5
Let's look at two things for stablecoins: top accumulators and top outflows. On the accumulation side, it's hard to ignore the effect of the $COMP launch. The top two wallets receiving stablecoins over the last 7 days are both Compound wallets - namely the USDC and USDT markets:

Note that the above effectively represents Compound's net supply (not to be confused with gross supply). As a result of this influx, both of these Compound wallets are at the time of writing among the top 15 largest stablecoin-holding addresses. The rest are all exchanges and stablecoin treasuries.

On the outflow side, a significant amount of USDT has left Binance wallets over the last 60 days. In fact, holdings have gone from more than $1B down to less than $150M:

If we zoom out, the Binance outflow has been the main driver of exchange outflow since the massive influx in March/April:

3. Aave
Contributor: Isa Kivlighan, Head of Marketing at Aave
Aave Protocol surpassed $100M market size for the first time ever on June 10th and now stands at nearly $120M. The Aave Futuristic Dashboard shows the protocol’s current market size (amount deposited + amount borrowed), total value locked (funds currently stored and "locked" in the platform), and total amount borrowed:

Daily unique users per day has been steadily growing since April, with the platform’s all-time high occurring a few days ago on June 16th (627 users).

The volume of Flash Loans since the launch of Aave Protocol in January continues to increase. It is also interesting to note the accumulated earnings depositors get from Flash Loans. When a user executes a Flash Loan, a 0.09% fee is collected from the Flash Loan amount, 70% of which is redirected as extra income for depositors.

Aave has been aggressive in expanding its coverage to new assets and markets. Our newest market is Uniswap, which has been live since May 28th and already contains $533K in total liquidity. So far in this market, interestingly, all of the borrowers have chosen to borrow at a variable rate and no Flash Loans have been executed yet (source).

4. Terra
Contributor: Christopher Heymann, Partner at 1kx
Since the last time Terra was featured on this newsletter, 6 weeks ago, Terra has paid out $820,000 to the validators in the network in real, non-dilutive rewards, bringing the total paid out network rewards to over $3.3 million to date. The rewards on Terra grew over the 58 weeks since mainnet launch at an impressive average week-over-week growth rate of 17%.


