Our Network: Issue #21
Coverage on the Bitcoin Halving and L1 Networks.

Interested in discussing on-chain analytics? Click here to join the Our Network telegram chat.
Welcome to Issue #21 of Our Network, the newsletter about on-chain analytics that reaches almost 2000 crypto investors every week.
This week our contributors cover L1 networks, and while we’re on the subject, I wanted to flag a video from a recent panel I moderated at the ReadyLayerOne conference about valuing L1 tokens:
The discussion ended up being highly engaging, informative, and fun—I highly recommend checking it out. The investor community has not reached consensus quite yet on how to value L1 networks, but it has made significant progress over the past few years.
Now let’s dive into this week’s coverage!
Network Coverage
This week our contributors cover the following networks:
Bitcoin
Cosmos
Decred
Ethereum
Tezos
🟢 Bitcoin
Contributor: Nate Maddrey, Research Analyst at Coin Metrics
Bitcoin experienced its third halving on May 11th, with block rewards dropping from 12.5 to 6.25. This marks a shift into a new era for Bitcoin, in more ways than one. Miner revenue, which is composed of block rewards and transaction fees, is critical to the overall security of the Bitcoin network. The more revenue, the larger the incentive for miners to try to win a block and claim the prize. This competition between miners ultimately keeps the network secure.
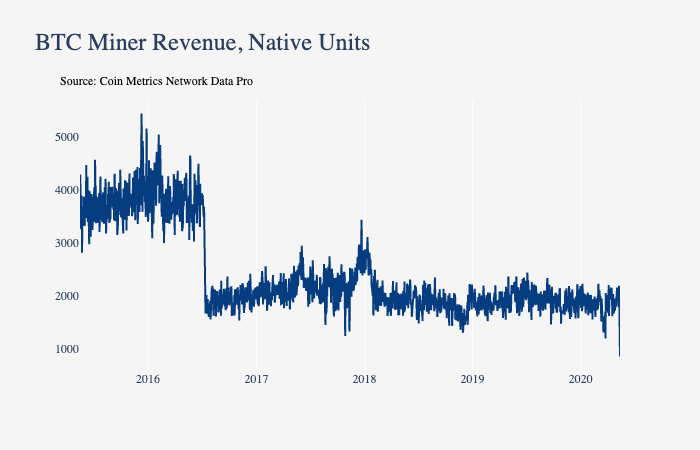
Up to this point, a large majority of Bitcoin miner revenue has been generated from block rewards. Over the last five years, only 4.38% of miner revenue has come from transaction fees, on average.
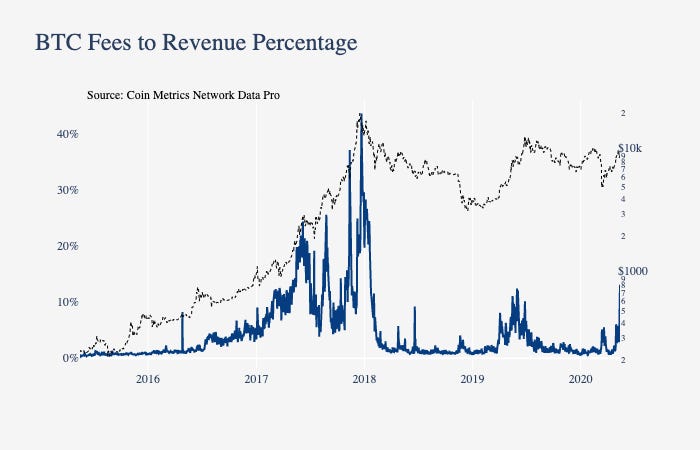
The recent halving decreased Bitcoin’s annualized issuance percentage to about 1.5%. In the long-term, lower block rewards will be a good thing for Bitcoin, as it means less supply dilution. But it also means less miner revenue, at least in the short-term.
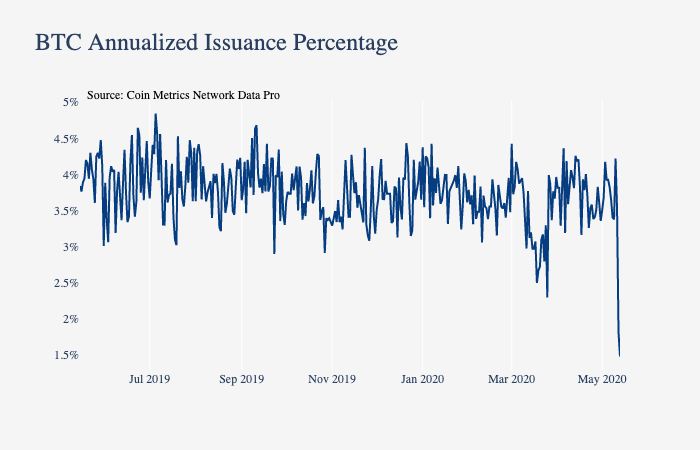
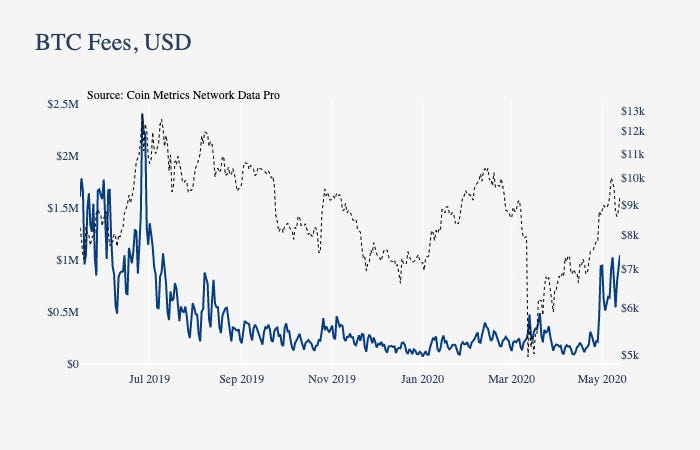
Over the long run the Bitcoin network will need to become more reliant on transaction fees to make up for that lost revenue.Interestingly, Bitcoin fees have been surging in the few days after the halving. Daily transaction fees hit $1.05M on May 13th, the highest daily total since July, 2019. A sustained surge in transaction fees would be good for miner revenue, and an overall positive sign for the long-term health of the network.
🟢 Cosmos
Contributor: Chjango Unchained, Director of Community at Cosmos
From 1 to 4 teams: What was once a single-celled 'organism', the Cosmos core development team has divided into multiple 'organisms'. In other words, the Tendermint team multiplied last March into these distinct teams with distinct responsibilities:
Tendermint Inc is responsible for the Cosmos SDK and ecosystem development of Cosmos.
Interchain Foundation manages grants to teams building infrastructure towards the Cosmos vision.
Interchain GmbH maintains Tendermint Core and leads the development of Interblockchain Communication (IBC), the flagship chain-agnostic protocol for communicating value and data across blockchains.
Iqlusion is responsible for running Game of Zones.
I know—it's a lot to take in. In short? This is unprecedented in the industry. The implication for Cosmos? This move arguably decentralizes the core development team by having multiple entities working on the same project, but without a core team intact, it inevitably increases coordination friction. But isn't enabling social coordination what blockchains are all about?
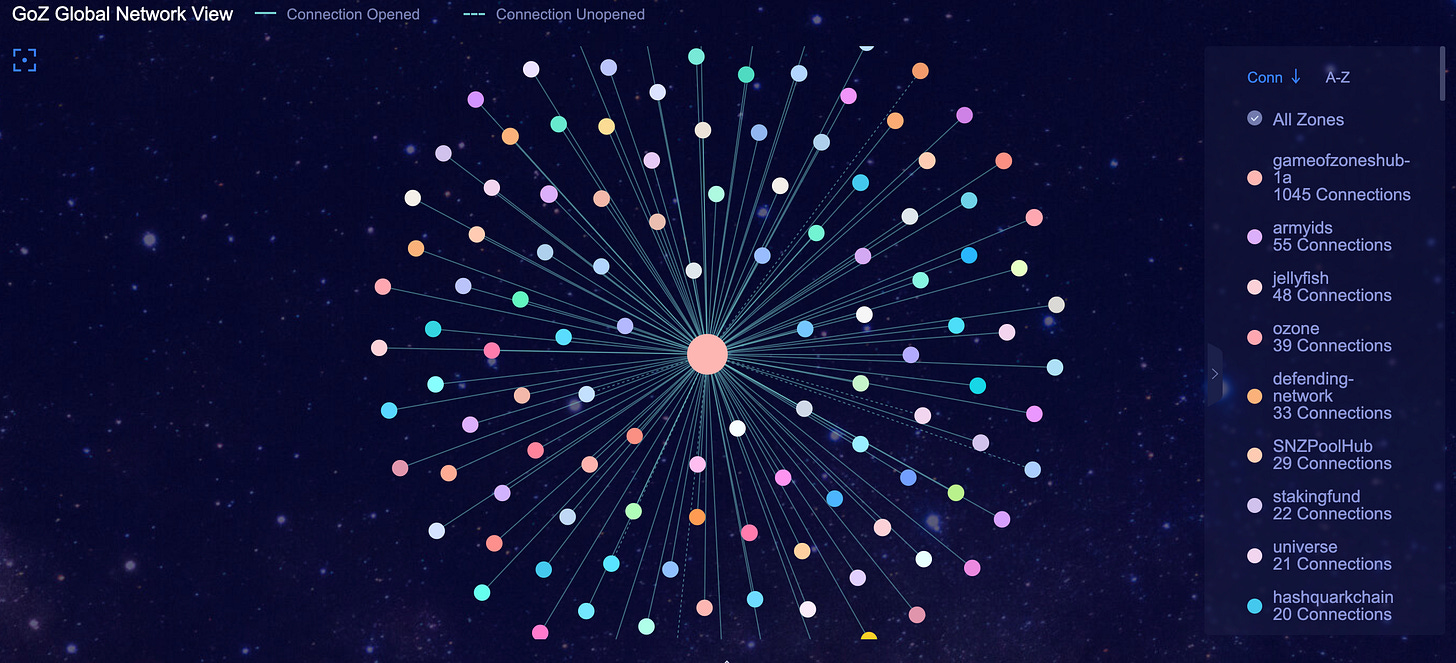
Game of Zones was initiated in the first week of May. There were 183 registrants with ~130 who successfully spun up testnet chains to make IBC connections at the beginning of the games. Teams and connections visualizer can be seen below (source). However, after a software upgrade, a fatal bug crashed the incentivized testnet game. A postmortem of the event can be read here. The next phase of Game of Zones is restarting May 18th after the bug fix is merged into the software.
The peg zone, or bridge space is a-booming! ChainSafe announced yesterday that it's launching ChainBridge, which will function as one of the several 2-way peg zones between not only Cosmos and Ethereum but for many other related blockchains. This peg zone model builds from the initial Peggy architecture that we laid out for Cosmos in early 2018. Many dev shop projects have since picked up the torch on building these chain bridges. ChainSafe's ChainBridge is one of many Cosmos <> Ethereum 1.0 bridges that will coming down the pipeline soon. Althea is launching their version of the peg zone, or 'Peggy', and they are "optimistic" about deploying one in the near future (full story here).
And that's not all there is for the bridging economy. Swish Labs is coming out with their own version of Peggy, giving this cross-chain network at least 3 bridges to start with by the end of 2020. If one were to analogize these peg zones to toll roads, then this multi-bridge system gives the user many different IBC options and fee models.
Cosmos governance is on its 25th proposal—and a rather significant one, at that. Prop 25 seeks community approval for CosmWasm to be integrated into the Cosmos Hub. If passed, it will enable faster feature integration for the Cosmos Hub post-IBC launch and will introduce a constrained form of smart contracting on the Cosmos Hub. Voter turnout is so far at 32% with a 99% Yes vote (source).

🟢 Decred
Contributor: Checkmate, Decred contractor
The Decred blockchain has a consistent baseload of demand for block-space, a result of the PoS ticket system and, more recently, on-chain CoinJoin privacy transactions. As such, the Realised Price metric differs in interpretation to Bitcoin. A strong conviction Decred holder actually has a regular and frequent on-chain signature moving DCR as opposed to the equivalent of long periods of dormancy for Bitcoin.
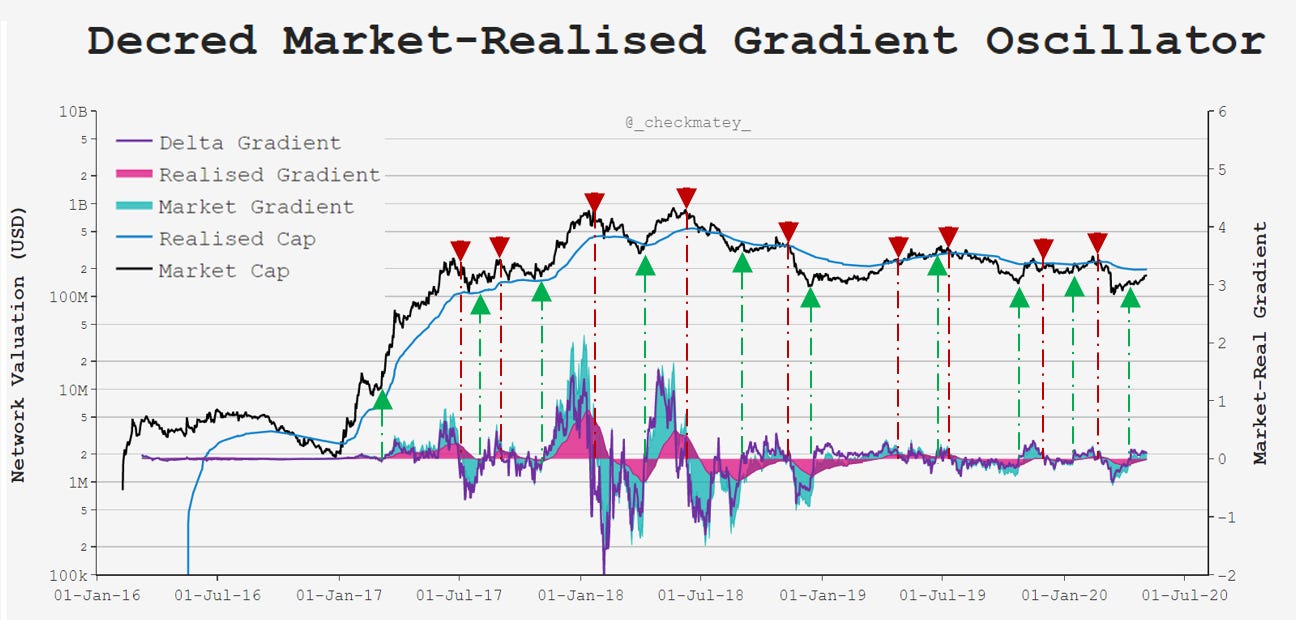
The Decred Realised Price tends to follow the spot price quite closely, however lags behind the day-to-day fluctuations in off-chain price on exchanges. The chart below presents an experimental metric that takes the 28-day gradient of the Market Cap and Realised Cap, and produces an oscillator from their difference (purple). This tool distills times where off-chain price momentum bias flips before the on-chain response is observed. This is due to DCR being bound in tickets and held in cold storage wallets which take time to transact. Where the oscillator crosses the zero level, it often precedes a shift in price momentum in the direction of the flip.
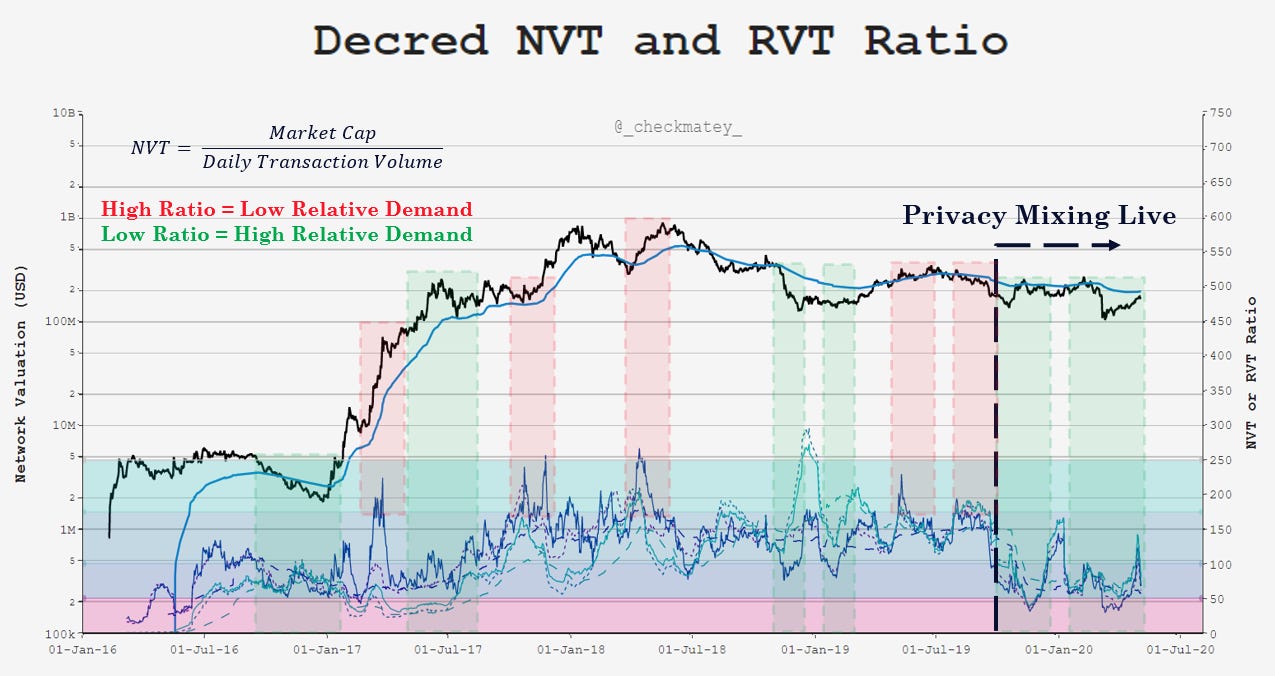
As noted, Decred has a consistent transaction demand which also shows up as reliable NVT and RVT signals. These metrics take the ratio between network valuation (market cap or realised cap) and the adjusted daily transaction value flowing through the chain, all denominated in USD. The chart below presents the NVT and RVT both in 28-day and 90-day moving average format with sound agreement in trend and magnitude between all.
During periods of bullish sentiment, we can observe low NVT|RVT ratios indicating that the chain is settling a substantial value relative to its network valuation, and vice-versa indicates bearish sentiment. Of particular interest is the period of strong demand for on-chain settlement since Aug 2019 at which point the CoinJoin privacy mix server came live. This provides valuable feedback for the community and developers regarding actual demand for the mixing service, and also gives miners a new basis for future fee market expectations.
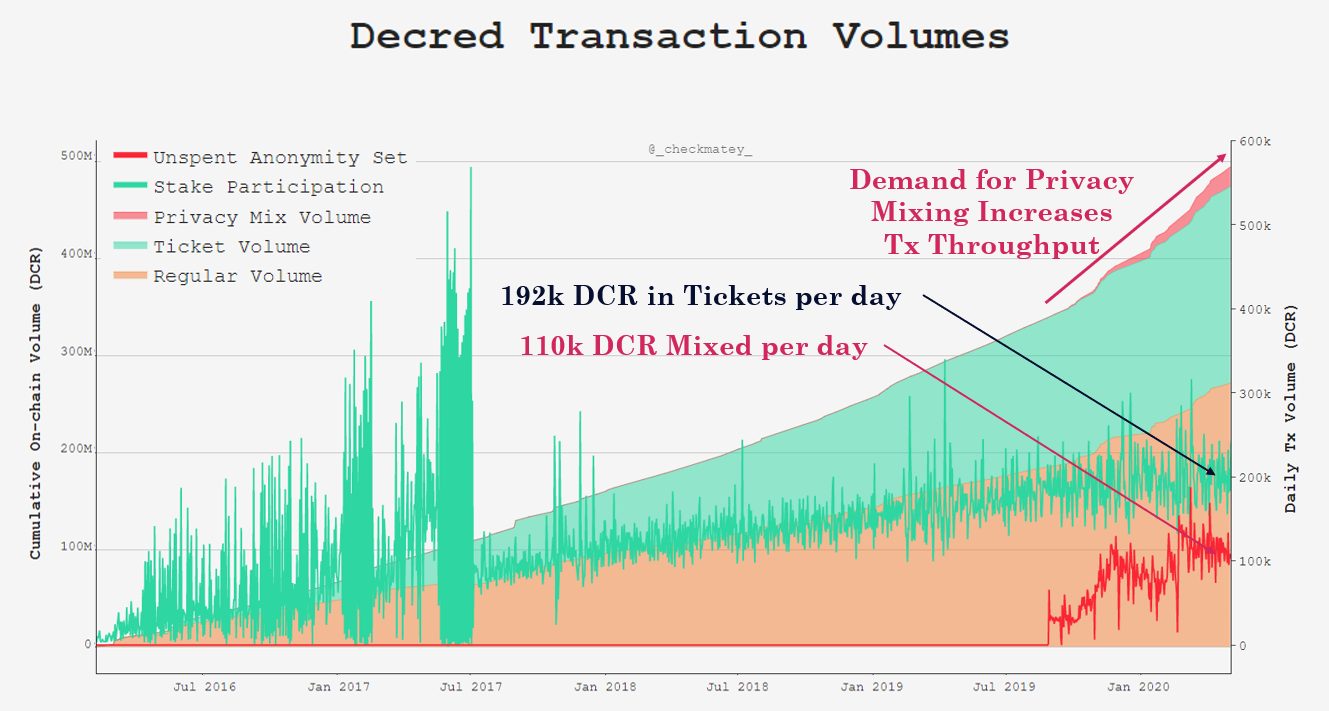
Digging into transaction demand further, the area chart below shows the cumulative DCR settled on-chain through protocol history, divided into regular transactions (orange), ticket purchases (green) and CoinJoin mixes (red). The line charts to the right axis presents the daily transaction volume in DCR for ticket purchases and CoinJoins.
The gradient of the area plot has steepened since the privacy mix service went live, confirming increased demand for block-space. There has been a steady uptick in DCR flowing through the anonymity set with around 110k DCR mined in CoinJoin transactions per day. This represents around 0.96% of the total circulating DCR supply in CoinJoins, and is substantial when compared to the 192k DCR that are mined into tickets daily (1.67% of circ. supply).
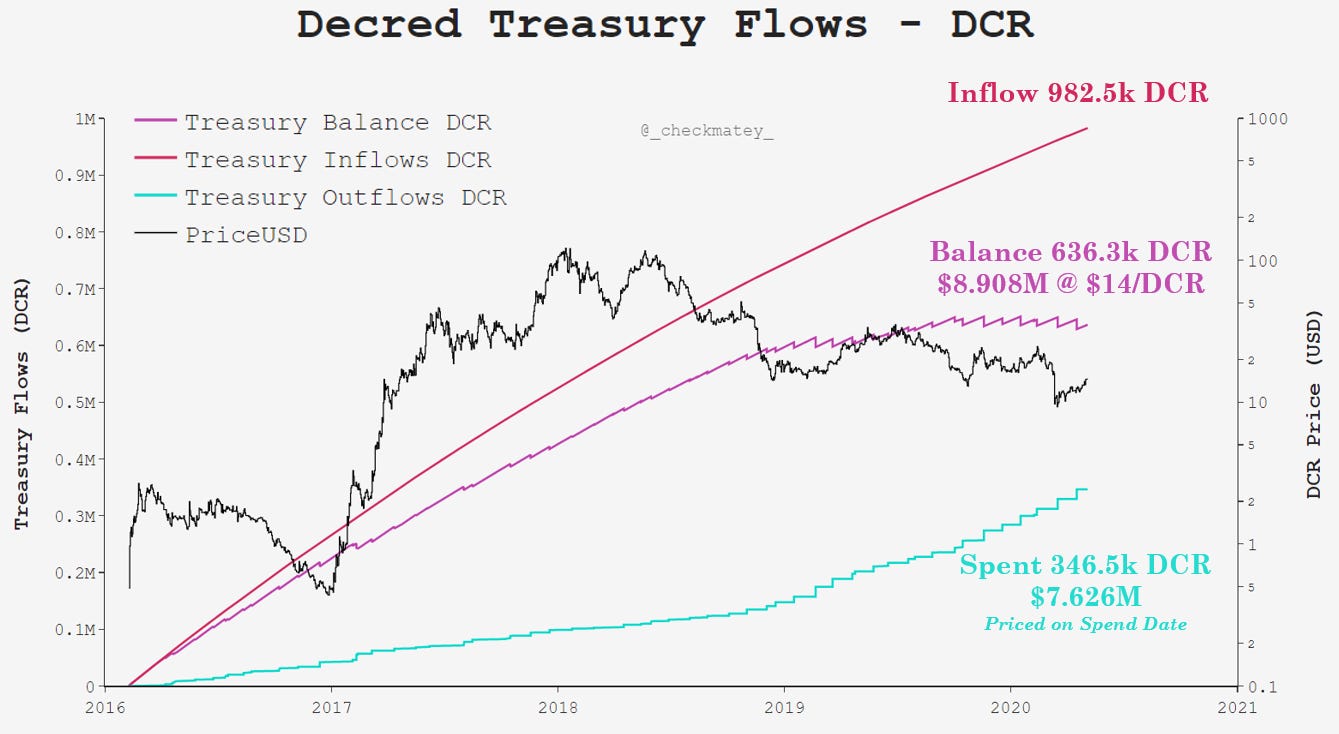
The Decred Treasury underpins the self-sovereign development of the protocol, and its accumulated value is subject to the market's pricing of DCR. To date, the treasury has spent a total of $7.625M bootstrapping the network from genesis to now when pricing each outgoing transaction on the day of the spend. This represents around one third of the incoming DCR so far and 16% of the total DCR inflows that will occur via the block subsidy ending in year 2140.
Based on a current DCR coin price of $14/DCR, the Treasury is capitalized with enough USD value to build another Decred (assuming $7.625M build cost) and can repeat that metric for each $12 uplift in DCR price given the current Treasury balance of 636.3k DCR.
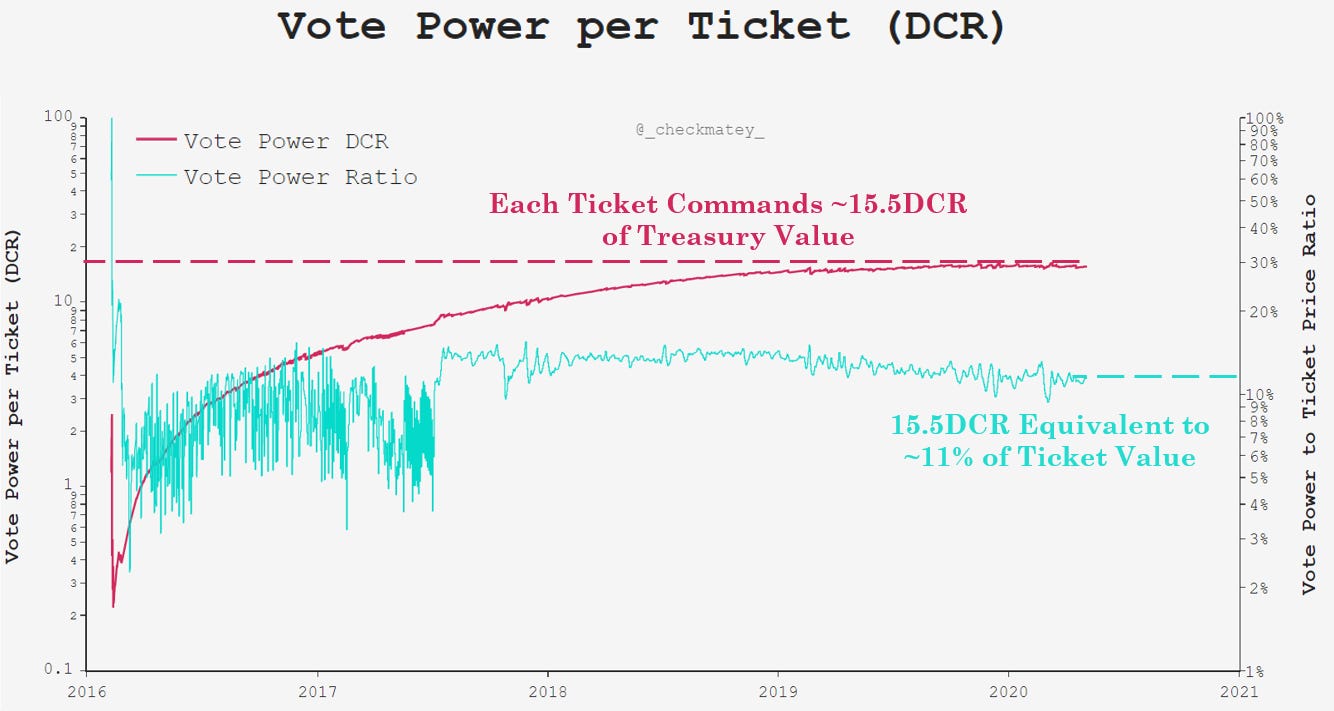
Finally, an interesting metric to gauge stakeholder governance power is to look at how much Treasury value is governed by each ticket in the PoS pool. The chart below presents the Treasury balance divided by the count of tickets in the pool (red), showing that each ticket commands decision making power of around 15.5 DCR. If we divided this by the purchase price of a ticket denominated in DCR (blue), governance power typically represents around 11% of the ticket value. Given tickets vote on average every 28 days, this means governance power on an annualised basis is equivalent to 143% of a typical ticket in value.
🟢 Ethereum
Contributor: Santiment
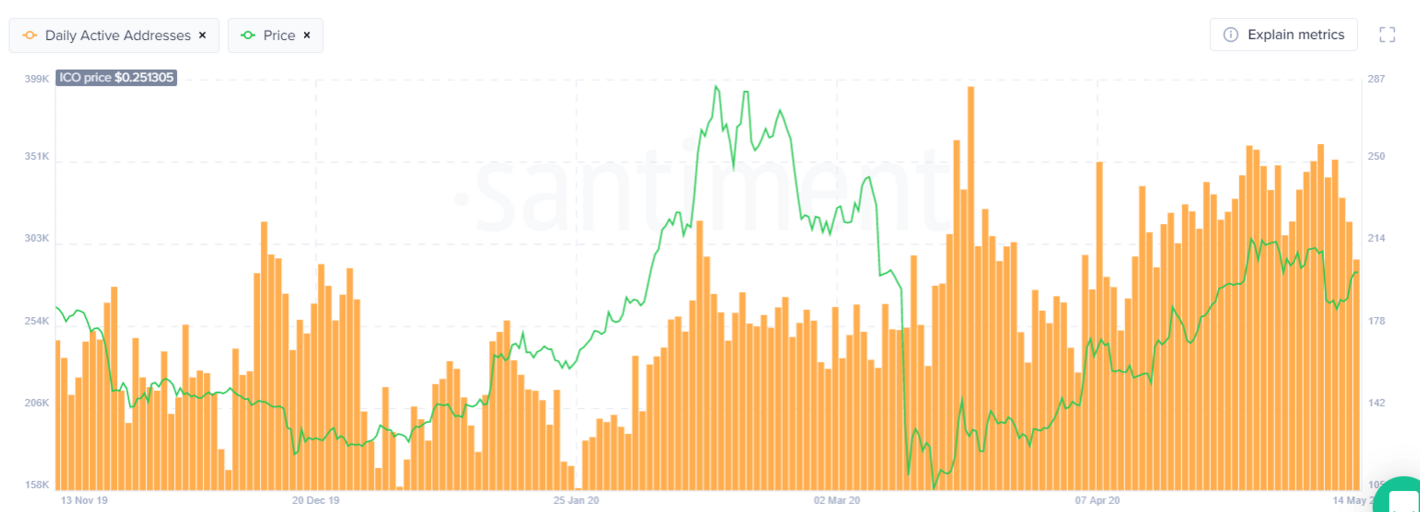
The Daily Active Addresses metric for Ethereum has improved steadily these past six months. After bottoming out in late January, it surged forward throughout ETH’s and many other altcoins’ great February respective runs. After Black Thursday, the DAA really exploded, and this in part has contributed to the enormous rebound from $85 over these past two months. Since this time, we have twice seen daily active addresses top out right on 361,000 on different days, both corresponding with price tops. We will see if its next attempt at this level can push past this fascinating barrier (source).
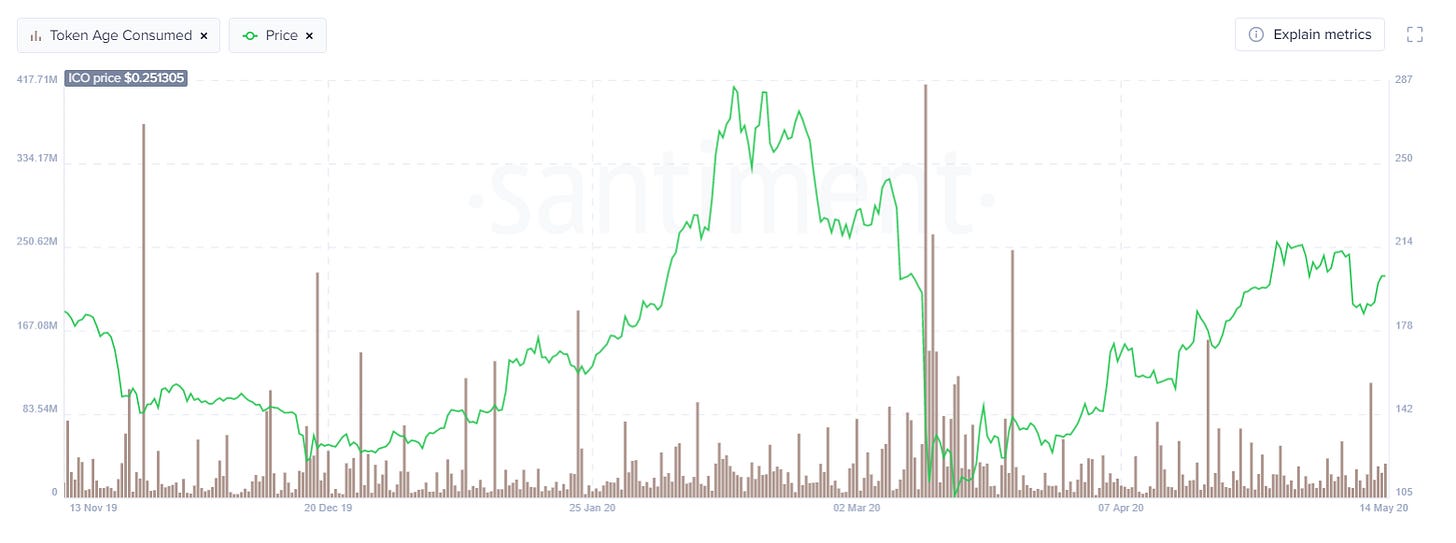
Substantial amount of tokens were moved at ETH bottoms. In several cases over the past couple of months, the ‘Token Age Consumed’ metric spiked whenever bottoms formed on Ethereum. This metric indicates the amount of tokens changing addresses on a certain date, multiplied by the time since they last moved. Spikes on the graph signal a large amount of previously dormant tokens on the move. So with this in mind, it was clear that old-time ETH holders have been increasingly active. Many dormant tokens ended up making big moves these past few months, particularly around Black Thursday (where a single day had 413.6M ETH consumed). In general, this is a primary indicator to indicate a price direction shift is imminent, and we can see that spikes have correlated with local bottoms heading all the way back to last November (source).
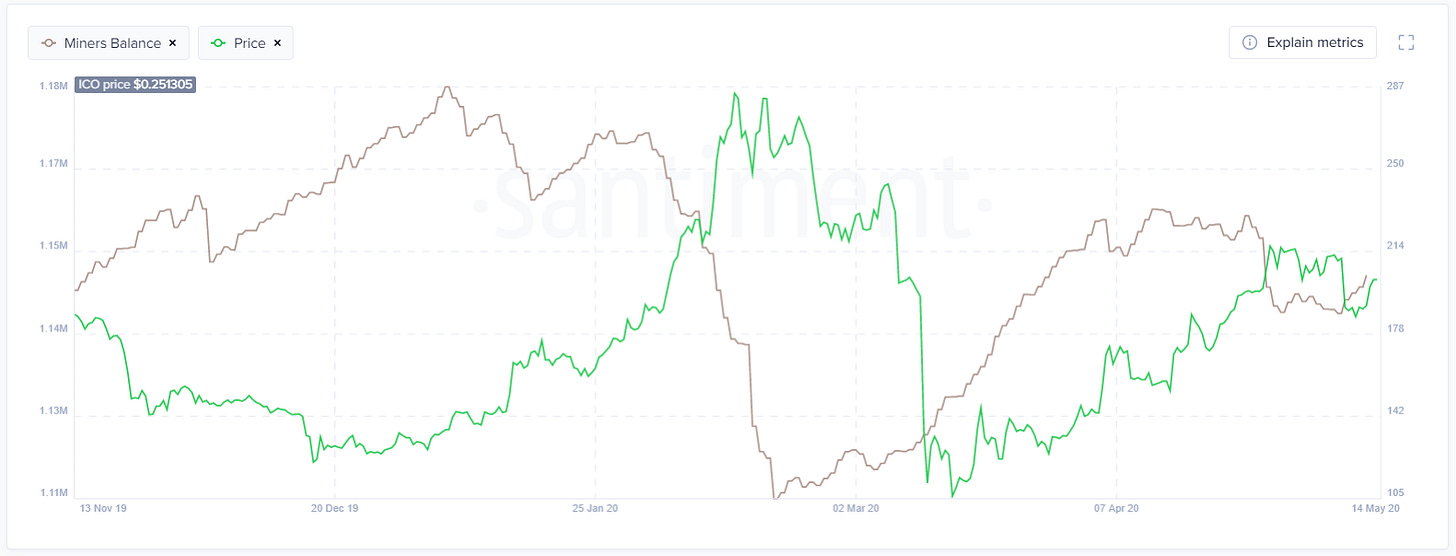
ETH miners have switched back to accumulation mode. After ETH miners’ balances bottomed out on Feb. 19th, just as the 6-month ETH price high was taking place, the balances very quickly increased. Heading through Black Thursday in mid-March and all the way through April 12th, miners added about 50,000 ETH to their wallets in this one-month timespan. Once again, as they dumped their balances over the week following, ETH’s price hit a local top. But since May 9th, we’re starting to see an accumulation trend again beginning to form (source).
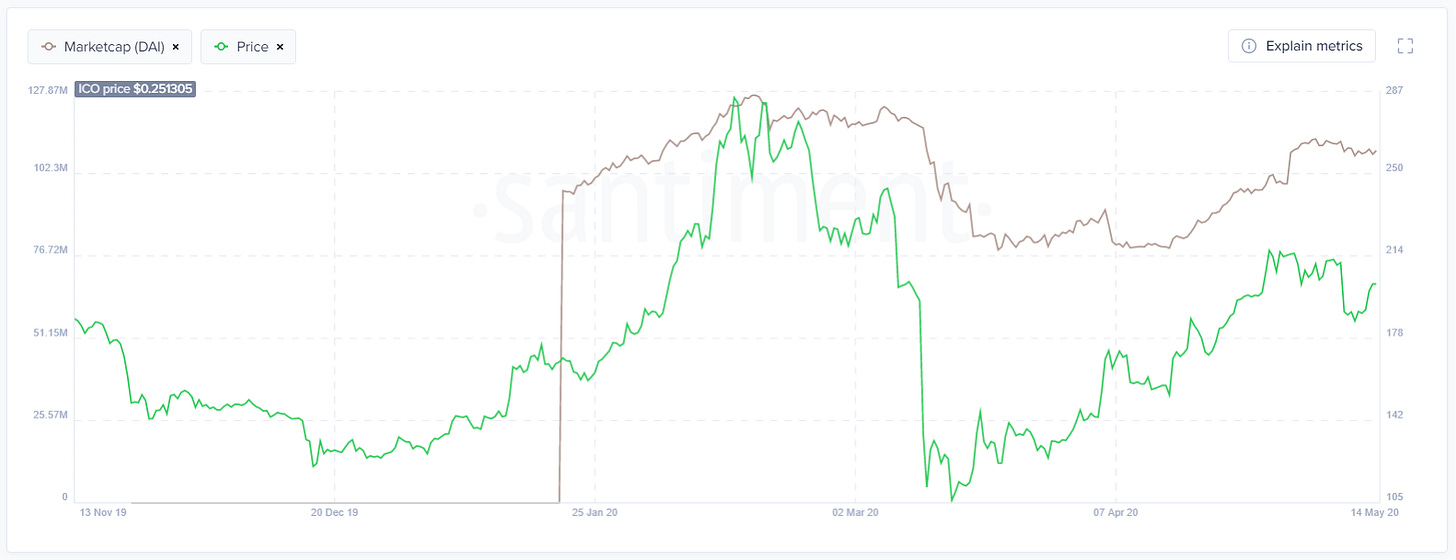
As we have noted in previous studies, the marketcap of DAI and Ethereum’s price tend to correlate in fascinating ways. Prior to ETH’s great price surge from late January to mid-February, we noted a steady increase in DAI’s marketcap. And again, even before its crash along with the rest of the crypto markets on Black Thursday, ETH’s price was foreshadowed by a slight dip forming in DAI’s marketcap on the days prior. DAI’s marketcap levels are now staying fairly level at a range of 108M to 111M (source).
