Our Network: Issue #19
Updates on Synthetix, MakerDAO, Terra, and Celo.

Interested in discussing on-chain metrics? Click here to join the Our Network telegram chat.
Welcome to Issue #19 of Our Network, a weekly newsletter about on-chain metrics and crypto analytics that reaches almost 2000 investors every week.
Before we dive into this week’s issue, I wanted to flag some interesting content for our readers. On Wednesday, I was joined by more than a dozen notable crypto investors, builders, and researchers to discuss the state of DeFi in a roundtable discussion that was livestreamed over Youtube.
The one-hour conversation turned out to be extremely insightful and touched on many topics that are highly relevant to Our Network readers, especially if you are a crypto investor. Check out the recording here:
I’ll be doing more roundtable livestreams like this in the future. Click here to subscribe to my Youtube channel and be notified next time we do one.
Network Coverage
This week our contributor analysts cover DeFi, including two emerging stablecoin projects:
Synthetix
MakerDAO
Terra 🆕
Celo 🆕
📌 Synthetix
Contributor: Jordan Momtazi, Core Contributor at Synthetix
We frequently get asked about our trading audience, their behavior and which assets are most often traded. Today I’ve focused on data that highlights trade size across various categories and cohorts in the hope of adding some perspective on user behavior through this lens. With synthetix.exchange, we’ve executed a bottoms up approach, building our audience through word of mouth, engagement on Discord, and pulling users over from the Mintr experience. The exchange has improved in terms of UI and asset availability, and in turn has begun to pull in a more sophisticated trading profile. Our geographic focus has historically been towards western traders, however this may change in the second half of the year as the project pushes into the Korean and Chinese markets via local contributors, dApp language support, and exchange partnerships.
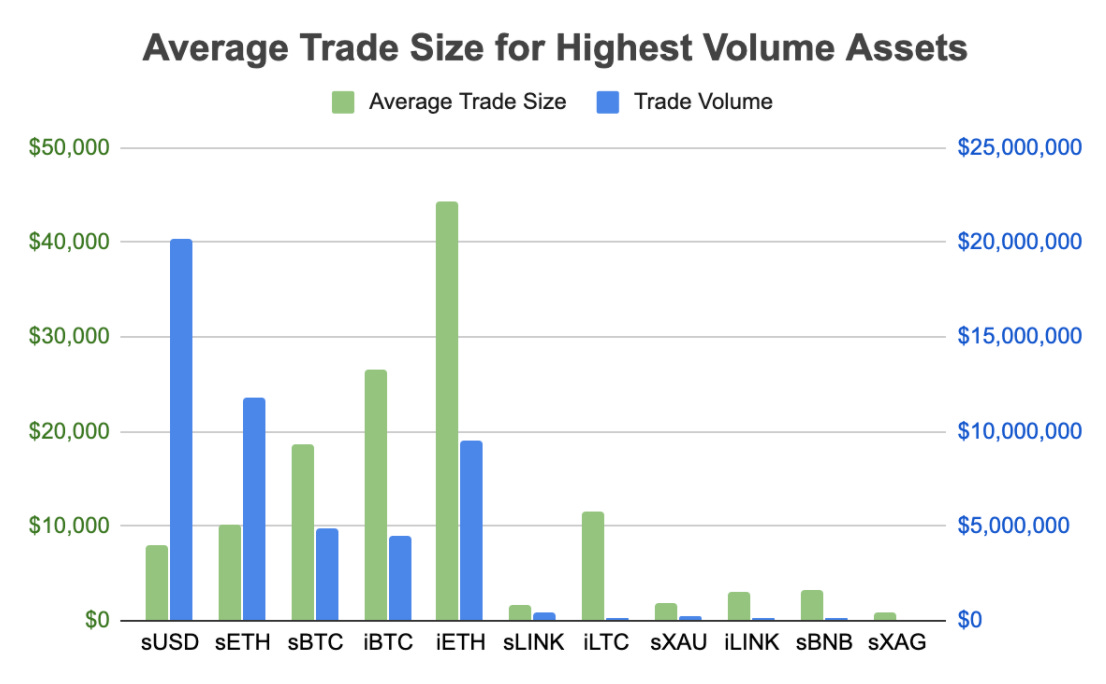
The below graph shows the average trade size against the highest traded assets over last 60 days. Apart from the usual suspects (sUSD, sETH, sBTC) we have a number of Synths which are gaining traction inside the exchange. Both iBTC and iETH have not only picked up volume ($4.4m & $9.5m respectively), but have the highest average trade size against any other assets over this period. These tokens track the inverse of the related asset and act as a proxy short for traders. iETH (which tracks the inverse of the ETH price) averaged $44k per trade while iBTC averaged $26k. These numbers indicate a trader profile who has larger pools of capital to deploy and looking to execute a sophisticated hedging strategy inside the exchange. Zero slippage and no holdings costs make inverse Synths a viable option for traders looking to optimally hedge.
The next graph again looks at average trade size over the past 60 days, but related to each asset class available on the platform. Volumes and size of trades are largest for the synthetic crypto assets ($30.6m/$7.2k) followed by FX ($21.8m/$5.9k). There is a steep drop off in volumes and trade size for both indices (which include the Nikkei 225 and FTSE 100) and the commodity Synths which currently consist of XAU (gold) and XAG (silver). The project is working towards adding more commodity assets in the near future and will be expanding into a wider range of indices in H2.

If we look at trader behavior in terms of volumes we can see that the majority of activity (and therefore fees) is being driven by users who trade more than $100k per month. The next largest cohort is sub $50k. The Synthetix platform is capable of handling large volumes as seen in Q1 and it’s interesting to see the split between heavy and light traders. Depending on the future set of assets, this distribution may skew even further.
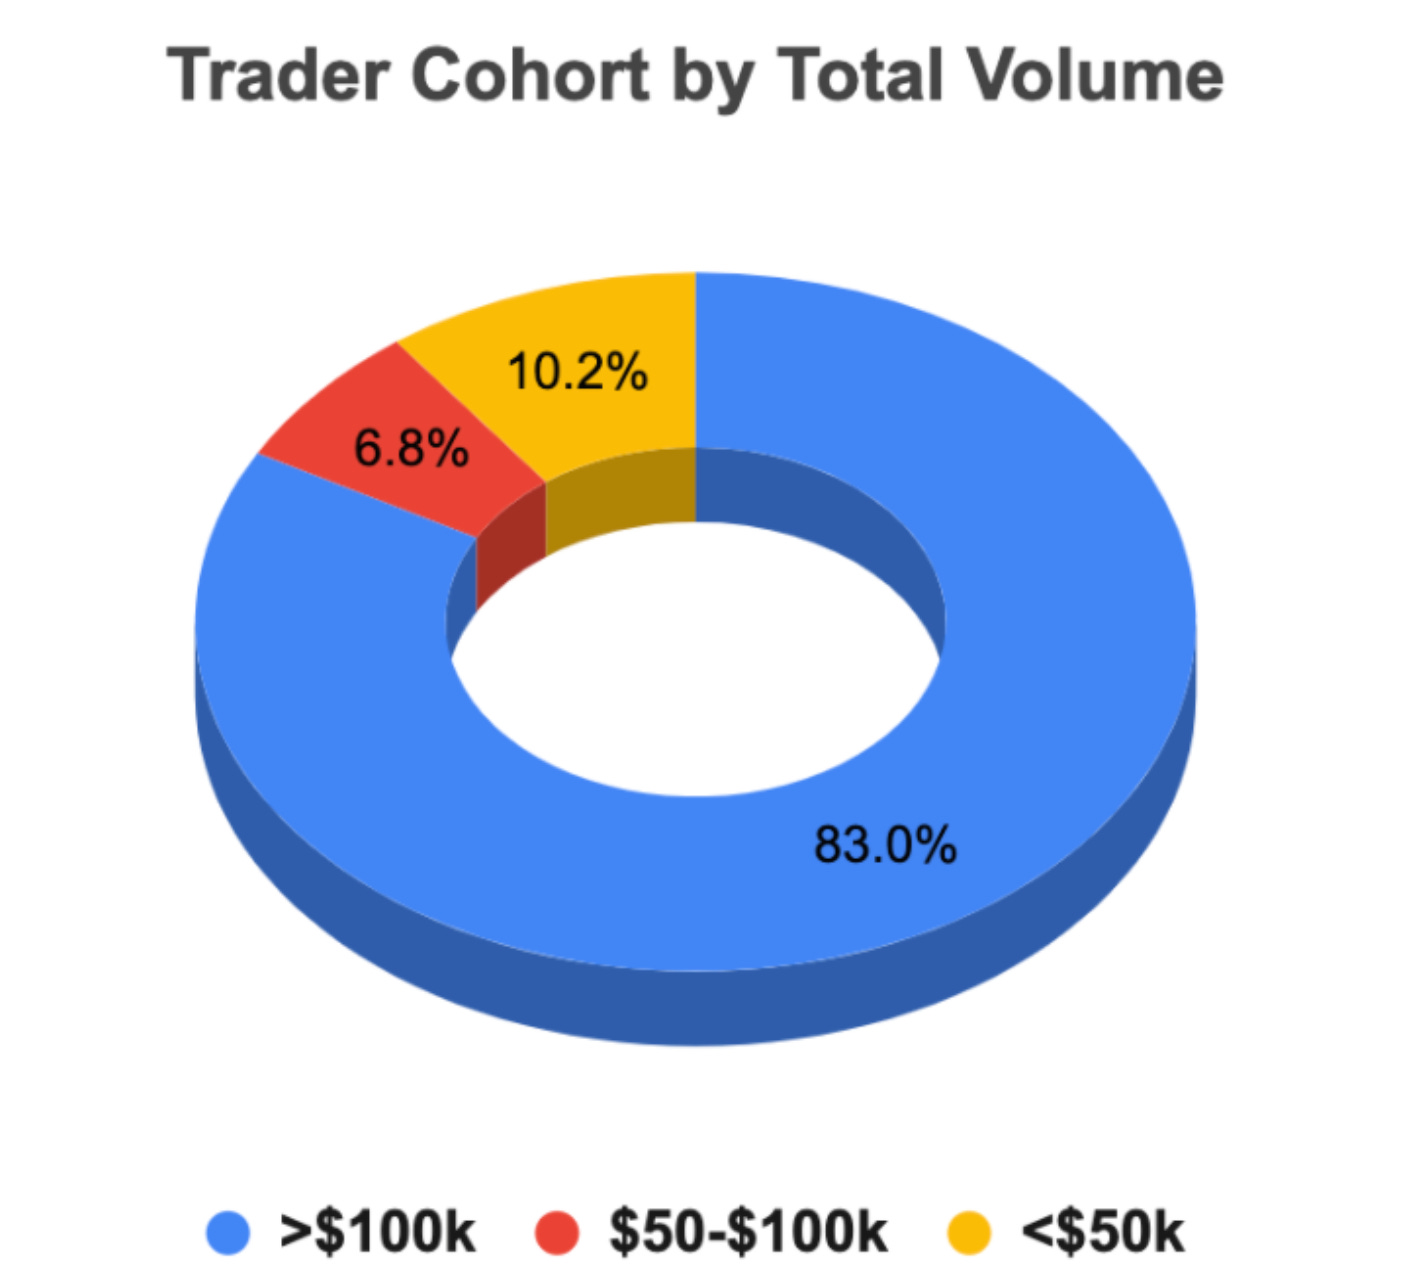
Adding to the previous data, we can see the breakdown of average trade size per volume based cohort. Those in the heavy trading category average $80k per trade, significantly more than the other two groups. With the majority of volume coming from this top cohort, we can extrapolate the utility they are receiving from zero slippage large trades. The lack of individual counter-party allows those seeking to move in and out or various assets the ability to trade into the spot rate without being concerned about order book depth or liquidity. As the platform expands in listing additional assets, alongside improved UX, we see this ‘zero slippage’ feature as a way to attract sophisticated traders who prefer to use a single non-custodial platform for multi-asset trading.

📌 MakerDAO
Contributor: Primož Kordež, Founder of BlockAnalitica
Dai Peg & Liquidity. MakerDAO governance is currently discussing additional collateral types due to the persisting DAI premium for about 6 weeks. After Black Thursday, DAI was trading most of the time around 1.02 range until it dropped to 1.01 recently, corresponding mostly to 17m net DAI minting during ETH rebound in the last 2 weeks. Orderbook analysis reveals there is still around 5.1m DAI bid above $1, mostly due to high DAI-USDC liquidity on Curve and Coinbase (3.2m DAI combined). This is however the lower bound, as not all DAI bids or DAI demand is revealed in orderbooks.


Source: DaiPeg.com
How does this compare with Dai price pre-Black Thursday? Last time DAI reached parity with USD was March 8th:
DAI supply back then was 122m, DSR at 8% and DSR utilization at almost 60%.
DAI supply now is 99m, DSR at 0% and DSR utilization 10%.
DAI supply difference of 23m, but 63m less DAI in DSR.
If a third of pre-Black Thursday DSR holders (72m) switched to other assets to reach higher savings yield or simply sold DAI and assuming all else equal, we could be already nearing demand and supply balance revealed by a stronger peg.
Single Collateral Dai Shutdown. MakerDAO governance voted for SCD shutdown to occur on May 12th. At that time, all SAI borrowers and holders will be able to claim their equivalent share of ETH. With that said, the migration was effectively finished on April 24th when the migration contract holding SAI liquidity was finally drained by the largest CDP holder, #3088. The amount of fees forgiven in SCD currently measures 1.5m in total, out of which a 1.03m fee write-off was effectively made for #3088. However, during the migration period, 800k fees were accrued in SCD and a large part of the fee write-off was associated with that period. With that said, it is unfortunate that a few borrowers received a far better outcome by postponing their repayment till the end.
Data by Dune Analytics shows that the migration was very successful. In about 6 months (starting from November 2019 until the final shutdown this May), more than 2000 CDPs used the migration tool to migrate their CDP to MCD. About 118m Sai was converted to Dai in total by using a migration tool.

Vault Usage. After Black Thursday, some people questioned whether MakerDAO lost confidence among its Vault users. In the three days between March 10th and March 13th, a high number of Vaults got liquidated or repaid and closed (1300, or more than one third of existing Vaults pre-crash). The number of newly created vaults was lower in the first 4 weeks after Black Thursday, as only about 20 vaults per day were opened versus an average of 40 in the period before the crash. This amount though has increased in this last week when we also witnessed the peg situation improving.
It may be that Vault owners simply didn't expect a rebound in ETH given the wider market instability after the crash and were cautious about levering up on ETH until recently. This view can be also confirmed by somewhat weaker ETH-based demand for DAI and USDC borrowing on secondary lending platforms such as Compound during the same period. Vault usage metrics show that market participants were probably risk averse towards ETH shortly after the severe price drop rather than losing confidence in the Maker system.

MKR Voting. The last executive vote at MakerDAO included record 8 changes to the system. This included changes about oracles, the DAI debt ceiling, USDC risk parameters and Governance Security Model delay. As the system grows in complexity, governance is becoming very important and demanding for regular community members to follow. However, data from mkrgov.science reveals there has been increased voting participation and a record amount of MKR that was staked and voted in the last executive vote. This is despite the increased governance overhead, as there are roughly 20 polls on a monthly basis. The responsiveness rate from those participating is also quite fast and on average measures about 2 days. Further, the share of MKR supply used for voting measures at 25%, up from 7-14% one year ago. There are around 50 unique monthly voting addresses participating in executive votes, but usually only a few whales (2-6) confirm the vote by reaching around 90% majority.

📌 Terra
Contributor: Christopher Heymann, Partner at 1kx
Terra is an algorithmic stablecoin ecosystem built on top of Tendermint that recently celebrated its 1 year main net anniversary. There are currently 4 stablecoins live in the Terra ecosystem, UST (USD), KRT (Korean Won), MNT (Mongolian Tögrög) and SDT (IMF SDR) with the majority of transactions occurring in KRT. Validators on the Terra network stake LUNA, the network’s native token. There are no inflation rewards, thus Validators participate/earn via transaction taxes on the total economic turnover of the network.
On a high level, Terra stablecoins achieve stability through the staking function of LUNA, which absorbs the volatility in the Terra stablecoins. LUNA provides a “central-banking function” algorithmically expanding and contracting the Terra stablecoin supply using an onchain mint and burn swap functionality, where market makers arbitrage-out any slippage between Terra and the currency peg. The most important metric for any stablecoin is its ability to maintain its peg to the assigned currency and since launching Terra’s KRT peg has remained strong.

What sets Terra mostly apart from other stablecoin approaches though is its real world adoption from its business partners. In many of the leading South Korean online services & E-Commerce shops you can already pay using Terra (see Figure 1 below). While merchant integrations present tremendous opportunities, it was crucial to onboard them slowly and allow the network to grow at a sustainable pace. Therefore, in the early months of mainnet, validators earned nearly no tax rewards as compensation for securing the network. To address this issue, multiple validators initiated “Project Santa” in early August 2019 in which Terra pledged 10 million LUNA tokens to subsidize a 10% staking reward for validators. On December 26, 2019 Project Santa was phased out and the network has since been self-sustaining with staking rewards ranging between 10% and 20%, without generating additional inflation (Figure 2).
Figure 1:
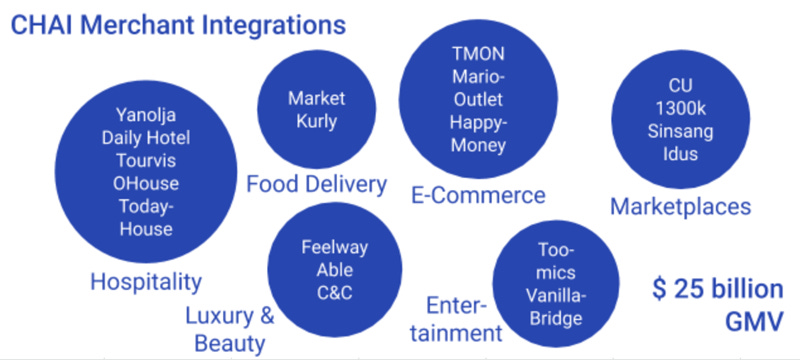
Figure 2:

Rather uncommon among cryptocurrencies, the majority of Terra network’s staking rewards are generated via real world purchases of goods and services. Through CHAI, Terra’s South Korean wallet partner, consumers make direct payments to the leading merchants and E-Commerce websites mentioned above. Almost $250,000,000 USD worth of goods or services have been purchased in the first 12 months via CHAI and the Terra network. Since a significant number of CHAI’s merchant partners operate in the hospitality category, growth has slowed around mid January.

Merchants are responding to Terra’s value proposition and integrating it into their payment offerings primarily for two reasons: (1) lower payment processing fees (currently 0.675%, vs ~2.3% for credit cards) and (2) near-instant settlement. Merchants have saved over 3.5 million $US to date in transaction fees that way. Through these merchant integrations and the fact that all blockchain & cryptocurrency-related activity is abstracted by CHAI (a custodial wallet), Terra has attracted massive account growth. There are over 1.3 million addresses on Terra that have made at least one transaction (we hope to dive into more detailed account and store metrics the next time we feature on Our Network). The below chart conveys how significant account growth is achieved through onboarding new stores.

One impressive last fact is the amount of fees collected by the Terra network until now. 2.4 million $US worth of KRT stablecoins have been distributed to validators since launch and the vast majority, over 92%, during the past 5 months alone. The daily average fee generation in the past 5 months was $16,225 USD. To put this into perspective: Litecoin, a Bitcoin code-fork optimized for payments that has been live for over 8 years and regarded by many to be the world’s third biggest blockchain, produced just $516 USD in average daily transaction fees during the same 5-month period. This comparison is not quite apples-to-apples, but it highlights the massive head-start in real world adoption that Terra has achieved in the short period since its launch.
📌 Celo
Contributor: Marek Olszewski, Co-Founder of Celo and CTO of cLabs
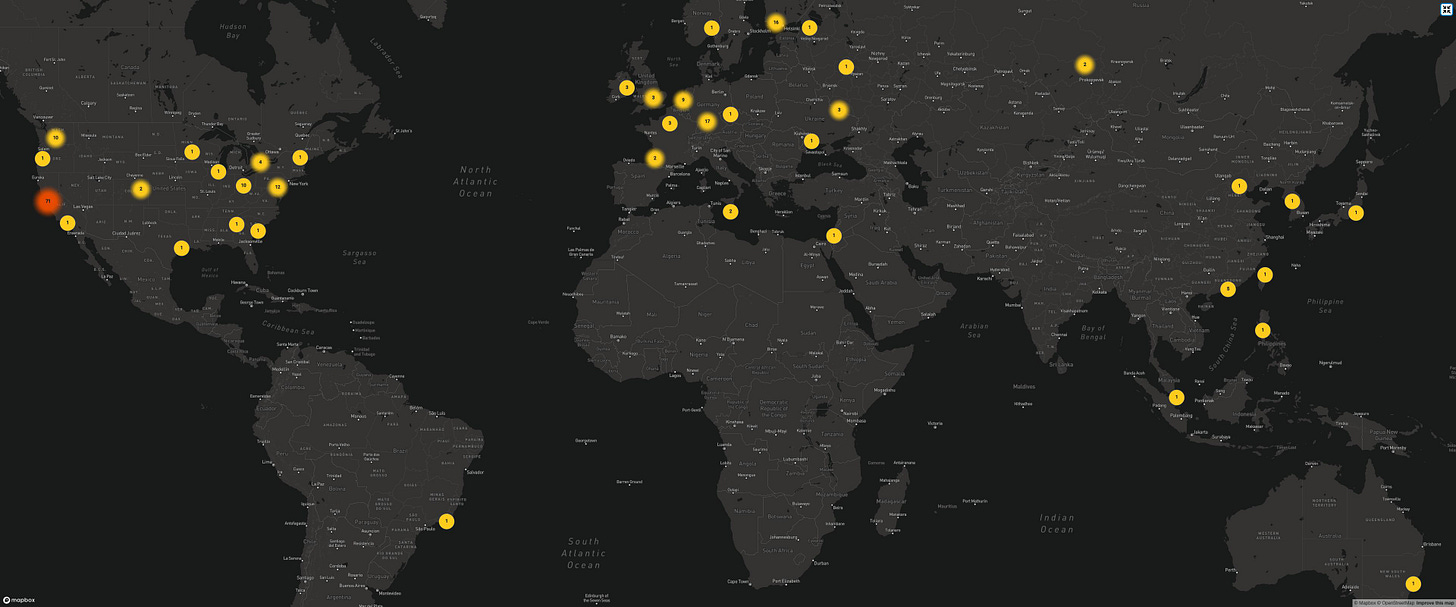
The Celo Mainnet Release Candidate network (RC1) was stood up by community validators on 4/22 shortly after 16:00 UTC. The genesis block included 65 validators across 19 countries that had placed in the top 70 of The Great Celo Stake Off incentivized testnet. Of the 65, ~56 validators had nodes ready and achieved quorum in less than 10 minutes. By end of day, 61 validators across the world were running Celo (source).
As of 4/30 2:30 UTC, RC1 is chugging along with 5 second block times on average and over 100k blocks processed in just over a week (source).

The validator community, in addition to securing the Celo network, continues solve its own needs by building tools for the ecosystem, including:
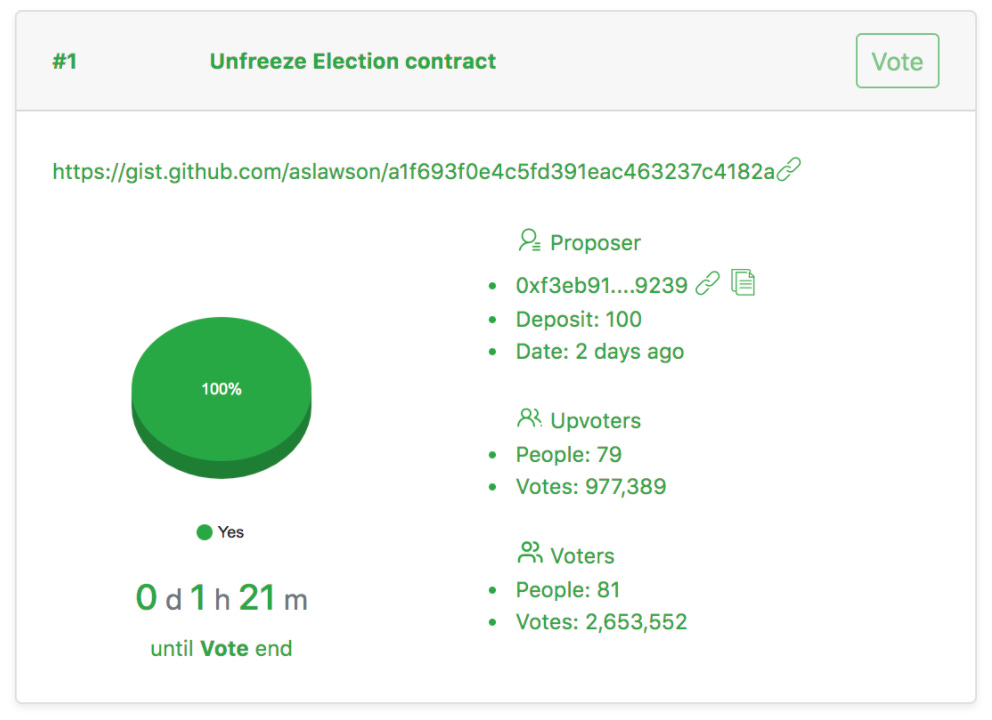
Currently the network is voting on a governance proposal to enable validator elections and validator rewards, which if it passes will take effect on 5/1. After this point, anyone can participate in Celo’s proof-of-stake consensus by locking up cGLD and running a validator node. Further governance proposals will include enabling voter rewards, and cGLD transfers, the latter signaling the graduation of RC1 to Mainnet, which is expected on or around 5/18 (source).
The cLabs team and other companies in the Celo community continue to keep BUIDLing, and contributions remain steady (source).


