Our Network: Issue #1
Updates from Compound, Synthetix, Uniswap, MakerDAO and Set.

Note from the editor.
Welcome to the first issue of Our Network, a weekly newsletter where top blockchain projects and their communities share data-driven insights about their networks.
My name is Spencer Noon and I lead investments for DTC Capital, a fundamentals-focused crypto investment fund. DTC Capital is stage-agnostic, which means we invest in both early-stage opportunities (equity and future tokens) as well as later-stage opportunities (primarily tokens). I spend most of my time working with entrepreneurs at the earliest stages of the company lifecycle, helping them navigate a space that can be both frustratingly fluid and idiosyncratic.
Every week the newsletter will feature interesting on-chain metrics and analyses of five projects, addressing one purposefully open-ended question: how healthy is this network? You won’t hear about the same networks every week. Instead, in an effort to keep our content fresh, you can expect to hear from projects roughly once per month.
We have assembled an all-star cast of contributors, each of whom will be covering a different project for the newsletter. All of our contributors either work directly for the projects themselves or are active community members, so this will be high-quality coverage. Updates will be in their words, although they may potentially be modified by yours truly for readability. This should provide a fascinating window into some of the industry’s most notable projects.
Whether you work full-time in crypto or are just a casual observer of the space, Our Network aims to deliver compelling data-driven insights from a wide range of networks and also educate readers about on-chain metrics.
Thank you for being a subscriber. This is going to be a lot of fun.
— Spencer
Network Updates
This week our contributors cover the Decentralized Finance or DeFi space:

Uniswap
Contributor: Caleb Sheridan, co-founder of Blocklytics
In this first edition, we’ll explore what makes this DEX extra special. So far this year, Uniswap has handled about USD 430M in swaps between ETH and tokens.
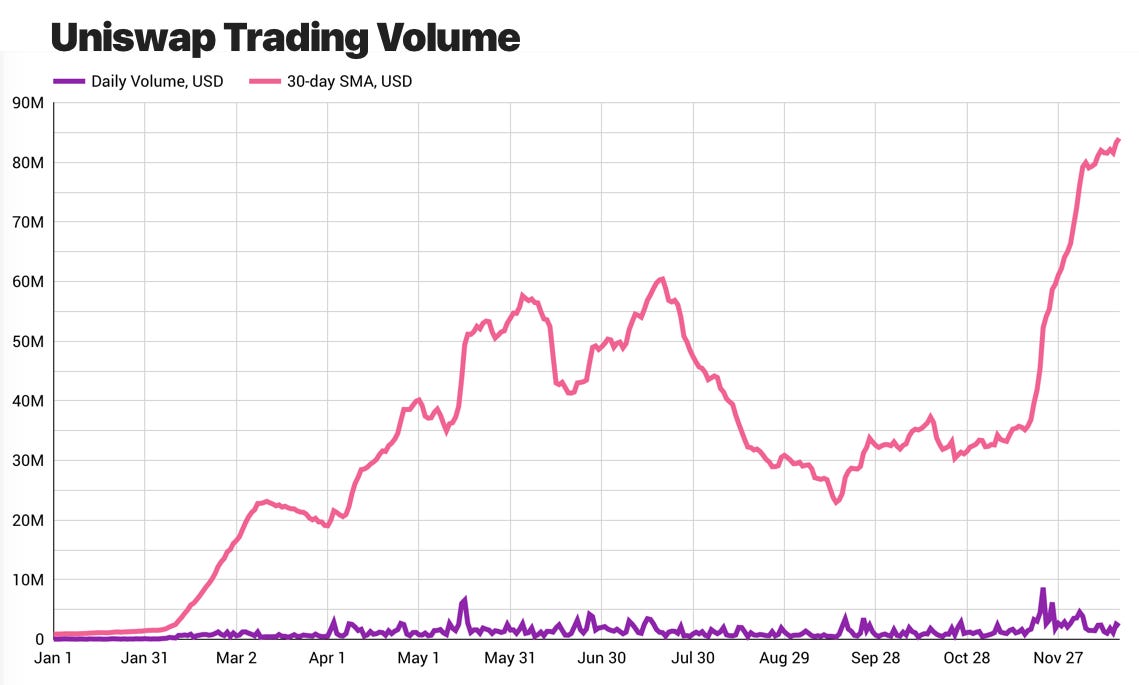
Uniswap is highly composable. Roughly 40% of Uniswap’s volume originates outside of its own smart contracts. KyberSwap is an example that uses Uniswap as an alternative liquidity source to give its users better prices on trades.

Uniswap requires liquidity to facilitate trades. Currently, there is around USD 25M pooled in Uniswap exchanges. The deepest pool currently handles USD 30K trades with 1% slippage.

Liquidity on Uniswap is fueled by incentives. By default, liquidity providers get 0.3% of trading volume. However, Synthetix has changed the game by adding external incentives to drive liquidity in the sETH pool, which has resulted in unprecedented growth.

Editor’s Note: Uniswap also recently hit an important milestone, with LPs now having earned more than USD 1M in fees in 2019 (source).


MakerDAO
Contributor: Primož Kordež, part of MakerDAO Interim Risk Team and founder of BlockAnalitica
Flippening Week has officially passed as Dai supply, collateralization, and liquidity have all have surpassed Sai.


MKR governance raised Dai Savings Rate (DSR) to 4% in order to attract Sai holders to migrate to Dai. As a result, DSR utilization increased from 15% to 25% over the past two weeks. However, it now seems that Sai CDPs are not migrating at the same fast pace anymore. A potential solution for this would be to raise the Single Collateral Dai (SCD) stability fee.
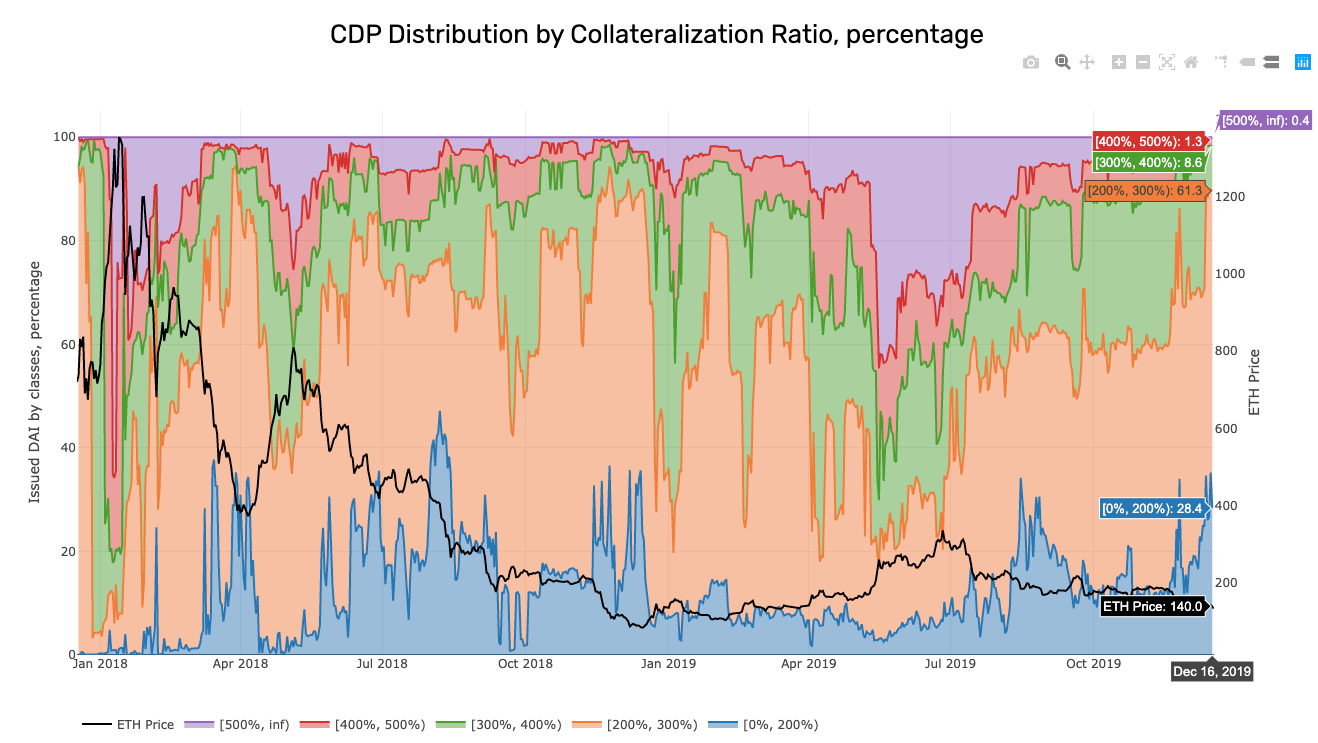
The collateralization ratio of SCD has decreased heavily over the past few weeks. It seems that the highest collateralized CDPs have migrated, which has made SCD less collateralized. MCD collateralization now stands at 260%, whereas SCD collateralization has fallen to 235%, which is the lowest number this year. Additionally, the distribution of collateralization levels among CDPs in SCD looks unusually low compared to average levels seen earlier this year. As you can see in the chart below, there's about 30% of SCD CDPs (in Dai debt terms) that have less than 200% collateralization ratio. This means that a 25% instant drop in ETH price would liquidate about 15m of SAI debt.
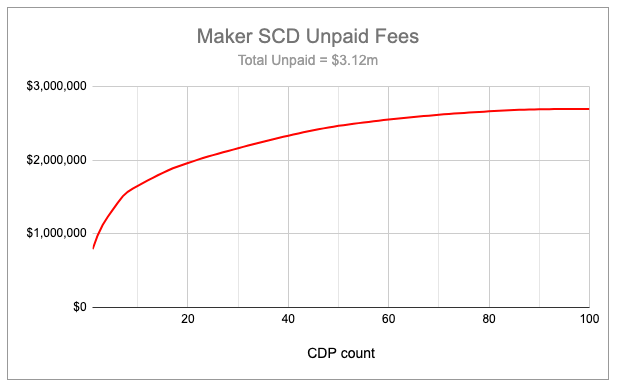
We are still waiting for the vast majority of SCD accrued fees to be paid as only ~36% (1.8m of 5.0m) of Sai fees have been paid. This is far less than the amount of Sai debt migrated to MCD (>50%), which means that mostly younger CDPs have migrated. Of the current unpaid Sai fees, ~50% is owed by only 10 large CDPs.
Secondary lending platforms and DEXs still hold about 12m Sai (1/4 of total supply). Most of it is deposited on Compound (8m Sai) — we are still waiting for those users to switch to Dai. However, it’s worth noting that Compound users aren't necessarily saving Sai only to make a yield on it. Instead, users borrow other tokens by using Sai collateral, which is probably why we aren't seeing Compound Sai suppliers migrating to the DSR yet despite its higher yield (2% vs 4%). Once Compound supports Dai as collateral, we should see more Compound Sai suppliers migrating to the Compound Dai market.

OKEx exchange is launching Dai DSR support for users, which will give them DSR yield (currently 4%) plus 1% extra yield as a customer acquisition incentive. This should boost Dai demand with external capital and might lead to upward price pressure. I expect more exchanges to do this in the future since DSR has unique features that are unlike secondary Dai savings platforms: (1) no redemption limits if utilization is close to 100% (run on bank resistance) and (2) no direct supply rate dependence on Dai borrowing demand (more predictable rates in short term).
Set Protocol
Contributor: Anthony Sassano, Product Marketing Manager at Set Protocol
Cumulative Set purchase volume reached $6.5 million USD this month with daily Set purchases spiking over the last week due to outperformance across all of our Sets.

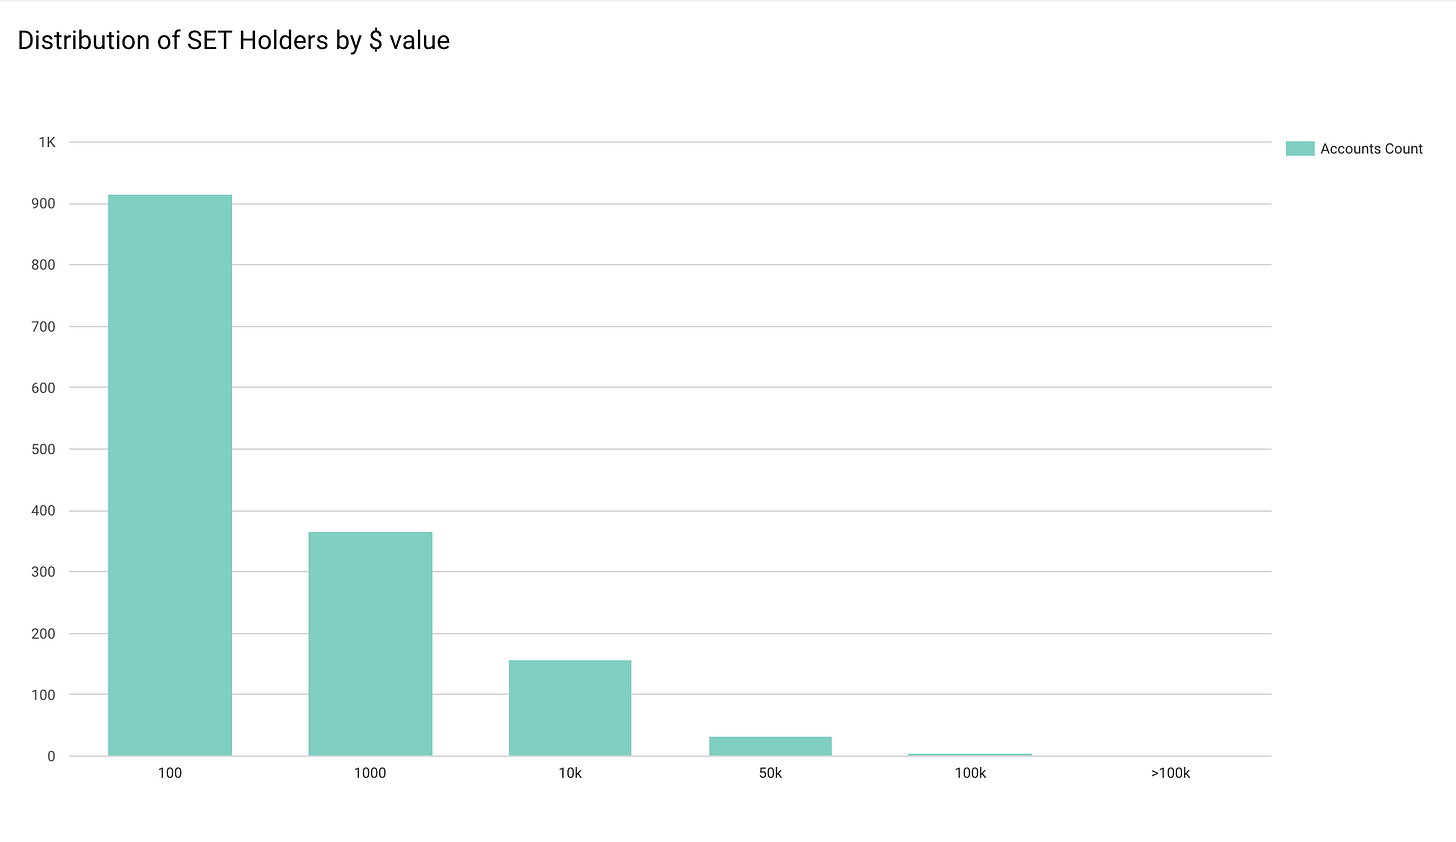
The majority of Set holders hold between $100 and $10,000 worth of Sets. I think this is an important metric because it shows that our protocol isn't just helping "ETH whales" but is also valuable to the wider DeFi/Crypto ecosystem.
The cumulative (lifetime) rebalance volume across all of our Sets hit $14 million this month. This means there has been $14 million worth of open on-chain auctions on Ethereum that a diverse set of market makers have participated in.
We integrated Compound tokens (cTokens) into Set Protocol last week and launched the first Set that contains cUSDC - the ETH RSI 60/40 Yield Set. Since then, the Set has seen an inflow of $70,000.
We were surprised by this number because the buy/mint process of this Set differs to other Sets. The non-cToken Sets are able to be minted using ETH, DAI, SAI or USDC no matter what asset the Set is currently positioned in. For example, if the Set is in ETH and the user pays with DAI, the DAI is automatically converted to ETH using Kyber's on-chain liquidity reserves.
With cToken Sets, specifically the ETH RSI 60/40 Yield Set, users need to bring their own cUSDC if the Set is positioned in cUSDC. By monitoring on-chain activity, we've been able to see that users are actually jumping through the hoops of having to exchange their ETH for USDC, go to Compound to supply that USDC & get cUSDC, and then use that cUSDC to buy the Set.
Synthetix
Contributor: Jordan Momtazi, VP Partnerships at Synthetix
Trading volume on synthetix.exchange has grown significantly since June with cryptoassets dominating synthetic asset trades. The corresponding trading fees that have been generated are significantly higher than any other DEX or DeFi platform.

Total monthly trades, as well as the number of unique traders, are both increasing month over month.

The average trade size on synthetix.exchange was $22k in November, which shows the power of 'infinite liquidity' as a result of the Synthetix pooled liquidity mode.

Compound
Contributor: Calvin Liu, Strategy Lead at Compound
Compound’s net supply volume is currently ~$120 million, with net borrowing of ~$30 million. These charts show Compound’s gross cumulative supply and borrowing instead -- checking in at ~$600 million and ~$140 million. This implies 4-5x turnover on assets supplied/borrowed to Compound over the past 31 weeks since Compound v2 launched. These assets are MOVING! It’s clear that the protocol is facilitating sizable economic activity multiples larger than what might be conveyed by the static “ETH Locked” metric.

Alongside supply/borrow activity, let’s look at liquidation activity. (Note: For the following three liquidation datasets, I’ve excluded liquidations < $100, as those have a very small economic impact and add noise)
As a reminder, borrowing positions are required to be over-collateralized; should a borrowing position become insufficiently over-collateralized, anyone can liquidate the borrowing account by repaying a portion of the outstanding borrow and collecting a portion of the associated collateral -- plus 5% as a liquidation bonus incentive.
We're approaching ~$10 million of liquidated collateral on Compound V2, which implies a captured profit of ~$500,000 by liquidators.
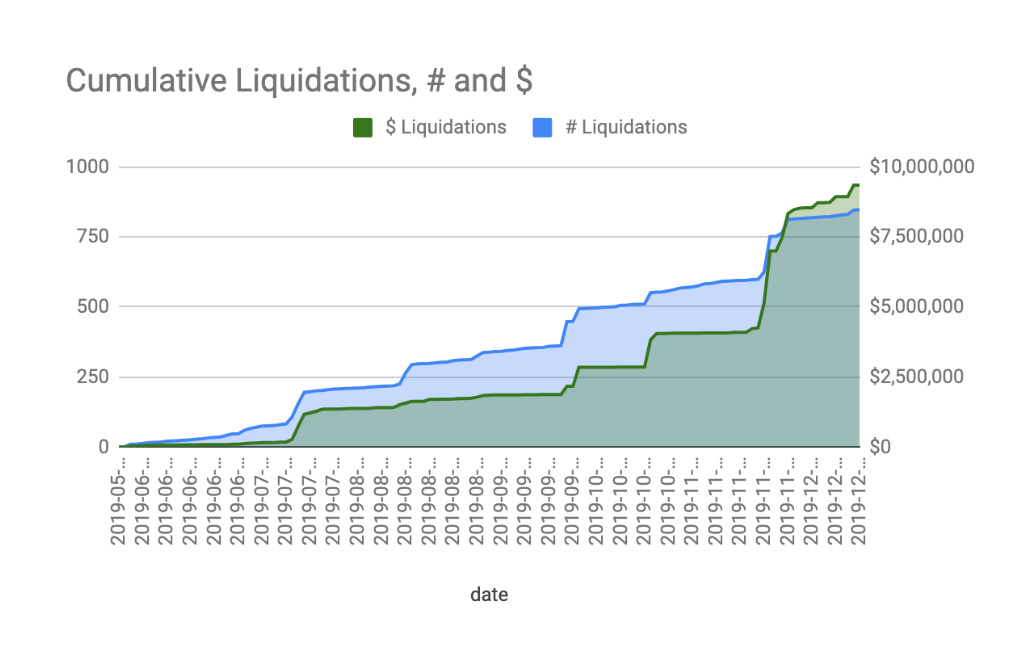
This liquidation profit opportunity has attracted a vibrant ecosystem of crypto hedge funds, liquidation bot developers, and individuals to efficiently perform liquidations of inappropriately collateralized borrowers on Compound.
This snapshot shows the distribution of liquidated collateral across the top liquidators in the Compound ecosystem, over the past 31 weeks. This distribution is not at all static; we see the ecosystem constantly evolving with new strategies emerging and quickly rising to the top of the “leaderboard” every few weeks/months. As Compound grows, we expect to see new and even more sophisticated liquidation strategies emerge.

Finally, let's take a look at the effect of the liquidation ecosystem on the health of borrower accounts who become insufficiently over-collateralized.
These charts show liquidated borrowers' "account health" 1 block prior to being liquidated, and 1 block after, charted against the size of the liquidation (on log scale). "Account health" is defined as the [borrower's actual collateralization ratio] / [Compound's required collateralization ratio]. So if Compound requires borrowers to be 130% collateralized, and a borrower reaches a 120% collateral level, that borrower's "account health" would be 120/130 = 92.3%. Accounts can be liquidated anytime they dip below 100% account health.
On the left, you can see that for any size of liquidation, the lowest account health any borrower has dipped to 1 block prior to being liquidated is about 92% (still over-collateralized at 120%, even though below Compound's requirement of 130%). And in fact, the vast majority of accounts are liquidated at account health values much closer to 100%! This implies that the liquidation ecosystem is functioning extremely quickly, and seizing liquidation opportunities as soon as they become available. (NOTE: there is a little bit of noise in these charts around the 100% line for various reasons -- data is never perfect -- but the conclusion holds)
On the right, you can see account health 1 block after being liquidated. Since it sometimes takes multiple liquidations to bring a borrower's account to full health, some of the data points are still below 100%. However, you can see that for the vast majority of accounts, there is a huge uplift in health post-liquidation. This means liquidations are not just bringing insufficiently overcollateralized borrowers back to healthy status, but are actually bringing them to VERY healthy status -- resulting in a safer and more secure protocol.

Our Network is a weekly newsletter where top blockchain projects and their communities share data-driven insights. Subscribe now to receive a crash course in on-chain metrics and crypto fundamentals, and never miss an issue.
About the author: Spencer Noon leads investments for DTC Capital, a fundamentals-focused crypto fund. He actively tweets about on-chain metrics.

